IES Blog

Institute of Education Sciences

IPEDS Finance Data Reveal How Pension Benefits May Contribute to the Growth of Public Postsecondary Institutions’ Financial Liabilities

In the long-standing conversation of high college costs, ever wonder what public colleges and universities owe? For Fiscal Year (FY) 2017, the National Center for Education Statistics (NCES) using the Integrated Postsecondary Education System (IPEDS) found that 1,624[1] public institutions carried debt and total financial obligations of $451 billion in current dollars (see figure 1).

New finance data from IPEDS can now provide more insight about these obligations than was previously available.

Several common financial obligations or liabilities[2] can be found across all U.S. postsecondary institutions. A portion of an institution’s liabilities can be attributed to pension benefits and contributions (i.e., pension liabilities). Since fiscal year 2015, IPEDS collected data on these obligations as a specific part of the total debt held by public postsecondary institutions.  For example, the total amount of pension benefits and contributions that public institutions owed their employees in FY 2017 was $95 billion (see figure 1).


Before FY 2015, institutions did not have to report to NCES their pension liabilities and the total liabilities for public institutions were $304 billion in FY 2014.  However, after the change in reporting standards, the total liabilities for all public institutions jumped to $395 billion in FY 2015. This increase is greater than increases in all other fiscal years from 2012 to 2017. This finding suggests that the implementation of the new pension reporting standards may have contributed to the change in the increasing trend of total liabilities data.

Reporting Change in Context

Prior to the revised pension reporting standards, dating back to 1997, public institutions reported the difference between their annual required contribution to the pension plan(s) and the actual annual contribution (e.g., net pension obligation). The revised standards—known as Government Accounting Standards Board (GASB) Statements 67 and 68—require institutions to report the entire unfunded pension amount (e.g., net pension liability), not just the amount of deficiency in annual payments.

Including the full current pension liability of the institution instead of the annual shortfall in pension funding of the institution resulted in large shifts in the balance sheet of many public institutions. For example, if an institution had a total of $2 million in pension liabilities, prior to 2015 this institution would not report the $2 million in net pension liabilities, just the amount below the required contribution for that year that was actually paid. Now, this institution must report the full $2 million in net pension liabilities, even if the annual required contribution had been paid in full. This revision of the financial reporting standards resulted in increased transparency and accuracy of the total amount of liabilities reported by institutions.

Additional IPEDS Resources

NCES encourages educational researchers to use IPEDS data—a primary source on U.S. colleges, universities, and technical and vocational institutions. For more information about the IPEDS data, visit the IPEDS Survey Components page.

While finance data from the IPEDS collection may seem to be targeted for accountants and business officers, researchers interested in a postsecondary institution’s financial health can explore through expense and revenue metrics, resulting in possible data-driven, bellwether information. To learn more about an institution’s finance data, in particular its pension benefits, click here for the current finance survey materials; archived changes to the survey materials in 2015–16 (FY 2015)—such as the implementation of the new pension reporting standards; and links to Video Tutorials, FAQs, glossary definitions and other helpful resources.  


 By Bao Le, Aida Ali Akreyi, and Gigi Jones


[1] This total includes 735 four-year public institutions, 889 two-year public institutions, and 63 administrative public system offices (41 four-year and 22 two-year offices). Administrative system offices can report on behalf of their campuses. The four non-Title IV-eligible U.S. service academics are not included.

[2] Liabilities include long-term debts (current and noncurrent) as well as other current and noncurrent liabilities such as pensions, compensated absences, claims and judgments, etc.

New Report on Crime and Safety in Schools and College Campuses

Crime in the nation’s schools and college campuses has declined overall during the past two decades, according to a report released on April 17, 2019. Indicators of School Crime and Safety 2018 highlights new information on a wide array of data points, including youth opioid use, perceptions of bullying, and active shooter incidents in educational settings. The report also covers topics such as victimization, school conditions, school environment, safety and security measures at school, and criminal incidents at postsecondary institutions.

In 2017, students ages 12–18 experienced 827,000 total victimizations (i.e., theft and nonfatal violent victimization) at school and 503,800 total victimizations away from school. These figures represent a rate of 33 victimizations per 1,000 students at school, compared to 20 victimizations per 1,000 students away from school. From 1992 to 2017, the total victimization rate and rates of specific crimes—thefts, violent victimizations, and serious violent victimizations—declined for students ages 12–18, both at school and away from school.

This edition of Indicators of School Crime and Safety includes an analysis of active shooter incidents, which represent a small subset of the possible violent incidents that occur at schools. While rare, these events are of high concern to all those interested in the safety of our nation’s students. From 2000 to 2017, there were 37 active shooter incidents at elementary and secondary schools and 15 active shooter incidents at postsecondary institutions. During this period, there were 153 casualties (67 killed and 86 wounded) in active shooter incidents at elementary and secondary schools, and 143 casualties (70 killed and 73 wounded) in active shooter incidents at postsecondary institutions.

Between July 1, 2015 and June 30, 2016, the most recent period available, there were 18 homicides of school-age youth (ages 5–18) at a school out of the 1,478 homicides of school-age youth in the United States. During the same period, 3 of the 1,941 total suicides of school-age youth occurred at school.

In 2017, about 20 percent of students ages 12–18 reported being bullied at school during the school year. Between 2005 and 2017, the percentage of students who reported being bullied at school declined overall and for most of the student and school characteristics examined.


Of the students who were bullied in 2017, about 56 percent felt that those who had bullied them had the ability to influence what other students thought of them. A higher percentage of female students (62 percent) than male students (48 percent) reported that those who bullied them had the ability to influence what other students thought of them.


The new report included a special analysis that shows that the percentage of 8th-graders who reported using heroin during the past 12 months decreased from 1.4 percent in 1995 to 0.3 percent in 2017. The percentage also decreased from 1.1 to 0.2 percent for 10th-graders and from 1.1 to 0.4 percent for 12th-graders during the same period. This 0.4 percent of 12th graders reflects 15,900 students, who were recent users of heroin. The use of OxyContin and Vicodin during the past 12 months also generally decreased for 8th-, 10th-, and 12th-graders between 2005 (the first year of data collection for these survey items) and 2017.


There were also decreases for other types of substance abuse. The percentage of students in grades 9–12 who reported using alcohol at least once during the previous 30 days decreased from 47 to 30 percent between 2001 and 2017. Also, the percentage of students in grades 9–12 reporting marijuana use at least 1 time during the previous 30 days in 2017 (20 percent) was lower than the percentage for 2001 (24 percent).

Other findings – elementary and secondary schools

  • About 99 percent of students ages 12–18 reported that they observed the use of at least one of the selected safety and security measures at their schools in 2017. The three most commonly observed safety and security measures were a written code of student conduct (95 percent), a requirement that visitors sign in and wear visitor badges or stickers (90 percent), and the presence of school staff (other than security guards or assigned police officers) or other adults supervising the hallway (88 percent).
  • About 6 percent of students ages 12–18 reported being called hate-related words at school during the school year in 2017, representing a decrease from 12 percent in 2001. This percentage also decreased between 2001 and 2017 for male and female students as well as for White, Black, and Hispanic students.
  • The percentage of students in grades 9–12 who reported having been in a physical fight anywhere in the previous 12 months decreased between 2001 and 2017 (from 33 to 24 percent), as did the percentage of students in these grades who reported having been in a physical fight on school property (from 13 to 9 percent).


Other findings – postsecondary Institutions

  • The number of on-campus crimes reported in 2016 was lower than the number reported in 2001 for every category except forcible sex offenses and negligent manslaughter offenses. The number of reported forcible sex crimes on campus increased from 2,200 in 2001 to 8,900 in 2016 (a 305 percent increase).
  • Race, religion, and sexual orientation were the categories of motivating bias most frequently associated with the 1,070 hate crimes reported on college campuses in 2016.

To view the full report, please visit https://nces.ed.gov/pubsearch/pubsinfo.asp?pubid=2019047.

Explore Transfer Student Data from the Integrated Postsecondary Education Data System (IPEDS)

Transfer students who attend full time complete a degree at higher rates than those attending part time. There were 2.1 million students who transferred into a 4-year institution during the 2009-10 academic year. At public institutions, which had the majority of transfer students (1.3 million) in 2009-10, 61 percent of full-time transfers completed their degree after 8 years of entering the institution, compared to 32 percent of part-time transfers (figure 1).


While NCES data users may be more familiar with the postsecondary transfer student data in the Beginning Postsecondary Study, NCES also collects data on this topic through the Integrated Postsecondary Education Data System (IPEDS) collection. IPEDS annually requires over 4,000 colleges and universities to report their transfer data starting from enrollment to completion. As defined by IPEDS, students who transfer into an institution with prior postsecondary experience–whether credit was earned or not–are considered transfer-in students. Students who leave an institution without completing their program of study and subsequently enrolled in another institution are defined as transfer-out students.

Below are some of the key data collected on student transfers through the different IPEDS survey components:

  • Fall Enrollment (EF): Transfer-in data

Collected since 2006-07, institutions report the fall census count and specific characteristics—i.e., gender, race/ethnicity, and attendance status (full and part time)—of transfer-in students.

  • Graduation Rates (GR): Transfer-out data

Collected since 1997-98, GR collects counts of students who are part of a specific first-time, full-time student cohort. Data users can calculate the transfer-out rates of first-time, full-time students by race/ethnicity and gender for each institution that reports transfer-out data. NCES requires the reporting of transfer-out data if the mission of the institution includes providing substantial preparation for students to enroll in another eligible institution without having completed a program. If it is not part of the institution’s mission, an institution has the option to report transfer-out data.

  • Outcome Measures (OM): Transfer-in and transfer-out data

Collected since 2015-16, OM collects information on entering students who are first-time students as well as non-first-time students (i.e., transfer-in students). Institutions report on the completions of transfer-in students at three points in time: at 4, 6, and 8 years. Also, any entering student who does not earn an award (i.e., certificate, associate’s degree, or bachelor’s degree), leaves the institution, and subsequently enrolls in another institution is reported as a transfer-out student. Click to learn more about OM. All institutions reporting to OM must report their transfer-out students regardless of mission.


NCES has been collecting IPEDS for several decades, which allows for trend analysis. Check out the IPEDS Trend Generator’s quick analysis of transfer-in students' fall enrollment. Also, the National Postsecondary Education Cooperative commissioned a 2018 paper that provides a high-level examination of the most common issues regarding U.S. postsecondary transfer students and presents suggestions on how NCES could enhance its student transfer data collection. For example, one caveat to using IPEDS transfer data is that information on where students transfer from or to is not collected. This means IPEDS data cannot be used to describe the various pathways of transfer students, such as reverse, swirling, and lateral transferring.[1]. While these nuances are important in today’s transfer research, they are out of the scope of the IPEDS collection. However, IPEDS data do provide a valuable national look at transfers and at the institutions that serve them. 


[1] A reverse transfer is defined as a student who transfers from a high-level institution to a low-level institution (e.g., transferring from a 4-year institution to a 2-year institution). Students who take a swirling pathway move back and forth between multiple institutions. A lateral transfer student is a student who transfers to another institution at a similar level (e.g., 4-year to 4-year or 2-year to 2-year). 


By Gigi Jones


CAPR: Answers to Pressing Questions in Developmental Education

Since 2014, IES has funded the Center for the Analysis of Postsecondary Readiness (CAPR) to answer questions about the rapidly evolving landscape of developmental education at community colleges and open-access four-year institutions. CAPR is providing new insights into how colleges are reforming developmental education and how their reforms are impacting student outcomes through three major studies:

  • A survey and interviews about developmental education practices and reform initiatives
  • An evaluation of the use of multiple measures for assessing college readiness
  • An evaluation of math pathways.

Preliminary results from these studies indicate that some reforms help more students finish their developmental requirements and go on to do well in college-level math and English.

National Study of Developmental Education Policies and Practices

CAPR has documented widespread reform in developmental education at two- and four-year colleges through a national survey and interviews on developmental education practices and reforms. Early results from the survey show that colleges are moving away from relying solely on standardized tests for placing students into developmental courses. Colleges are also using new approaches to delivering developmental education including shortening developmental sequences by compressing or combining courses, using technology to deliver self-paced instruction, and placing developmental students into college-level courses with extra supports, often called corequisite remediation.

Developmental Math Instructional Methods in Public Two-Year Colleges (Percentages of Colleges Implementing Specific Reform Strategies)

Notes: Percentages among two-year public colleges that reported offering developmental courses. Colleges were counted as using an instructional method if they used it in at least two course sections. Categories are not mutually exclusive.

Evaluation of Developmental Math Pathways and Student Outcomes

CAPR has teamed up with the Charles A. Dana Center at the University of Texas at Austin to evaluate the Dana Center Mathematics Pathways (DCMP) curriculum at four community colleges in Texas. The math pathways model tailors math courses to particular majors, with a statistics pathway for social science majors, a quantitative reasoning pathway for humanities majors, and an algebra-to-calculus pathway for STEM majors. DCMP originally compressed developmental math into one semester, though now the Dana Center is recommending corequisite models. Instructors seek to engage students by delving deeply into math concepts, focusing on real-world problems, and having students work together to develop solutions.

Interim results show that larger percentages of students assigned to DCMP (versus the traditional developmental sequence) enrolled in and passed developmental math. More of the DCMP students also took and passed college-level math, fulfilling an important graduation requirement. After three semesters, 25 percent of program group students passed a college-level math course, compared with 17 percent of students assigned to traditional remediation.

Evaluation of Alternative Placement Systems and Student Outcomes (aka Multiple Measures)

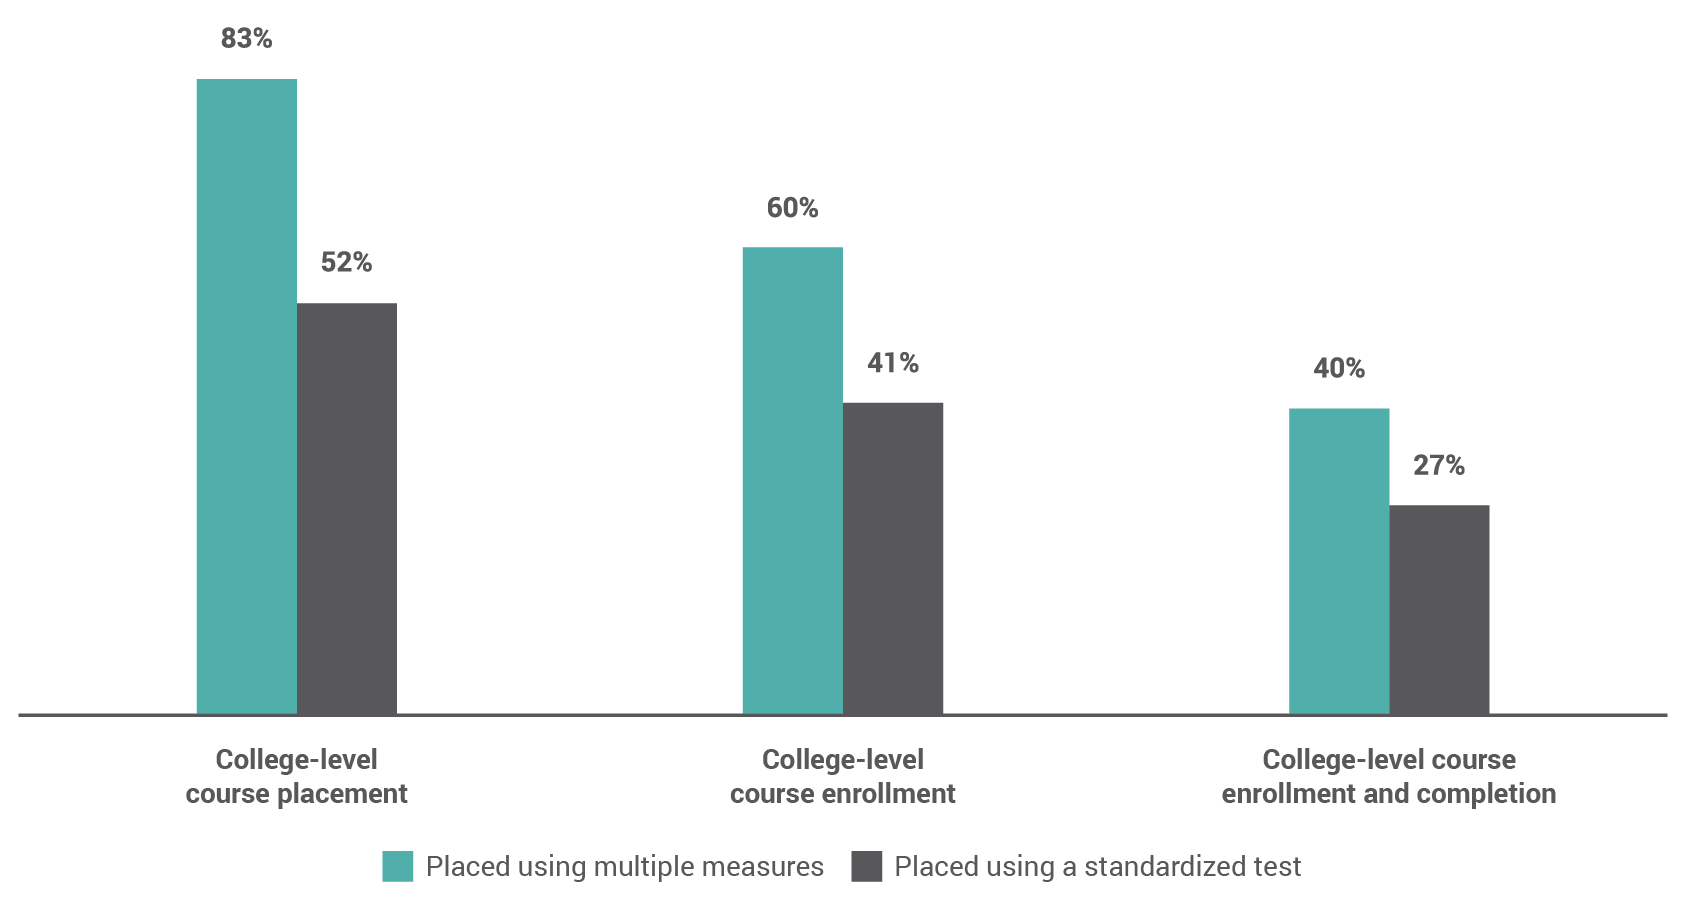
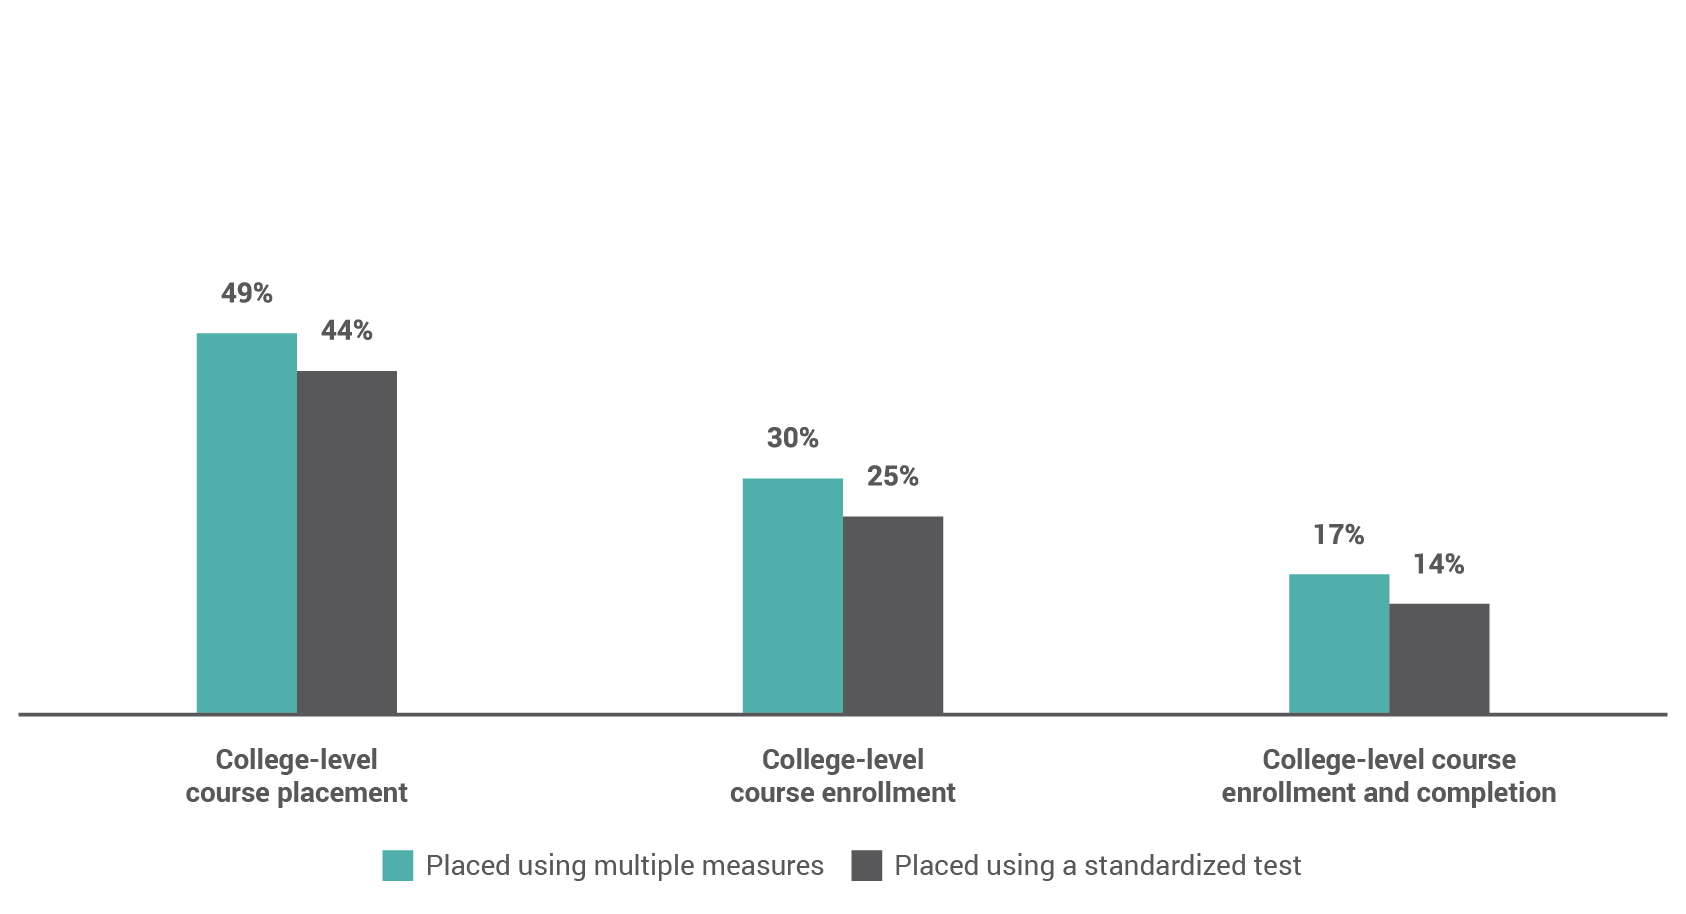
CAPR is also studying the impact of using a combination of measures—such as high school GPA, years out of high school, and placement test scores—to predict whether students belong in developmental or college-level courses. Early results from the multiple measures study show that, in English and to a lesser extent in math, the multiple measures algorithms placed more students into college-level courses, and more students passed those courses (compared to students placed with a single test score).


College-Level English Course Placement, Enrollment, and Completion in CAPR’s Multiple Measures Study (Percentages Compared Across Placement Conditions)


College-Level Math Course Placement and Completion in CAPR’s Multiple Measures Study

Looking Ahead to the Future of Developmental Education

These early results from CAPR’s evaluations of multiple measures and math pathways suggest that those reforms are likely to be important pieces of future developmental education systems. CAPR will release final results from its three studies in 2019 and 2020.

Guest blog by Nikki Edgecombe and Alexander Mayer

Nikki Edgecombe is the principal investigator of the Center for the Analysis of Postsecondary Readiness, an IES-funded center led by the Community College Research Center (CCRC) and MDRC, and a senior research scientist at CCRC. Alexander Mayer is the co-principal investigator of CAPR and deputy director of postsecondary education at MDRC.

Evaluating Oregon’s Adult Basic Skills Transition Planning Process: An Interview with Judith Alamprese

In her 2017 IES grant, Judith Alamprese (Abt Associates) is collaborating with the state of Oregon’s Office Community College and Workforce Development to evaluate a program that aims to help adults earn a GED® and transition into postsecondary education. This project is funded under the Low-Cost, Short-Duration Evaluation of Education Interventions competition, which supports research that aims to produce meaningful results for local and/or state education agencies quickly. Program Officer, Meredith Larson, interviewed Ms. Alamprese about this current work, how it came into being, and what it might mean for Oregon and adult education more broadly.

Tell us about your area of research and why it’s important to Oregon.

My current research is focused on determining effective interventions for assisting low-skilled adults establish and succeed in a career pathway. Oregon was one of the first states to implement a statewide initiative for transitioning adult basic skills learners (henceforth adult learners) to further education and work, and this project expands Oregon’s activities to support adult learners’ success.  

What is your current project studying?

The Transition Planning Process (TPP) project is a collaboration between Oregon’s Office of Community College and Workforce Development (CCWD) and Abt Associates (Abt). We are using a randomized controlled trial (RCT) to test whether text messaging helps adult learners earn a GED® and transition to postsecondary education and training.

What is TPP, and why is this approach innovative?

TPP is a text messaging intervention in which transition facilitators who work with the adult learners send text messages to the learners to help keep them on track to complete their GED® and enroll in postsecondary courses. The intervention is a supplement to the facilitators’ other transition activities to prepare learners for next steps in education and work.

TPP has a standardized list of text messages to prompt learners to take the GED® tests, set college goals, access information on college planning and other college preparation activities. Facilitators can send texts customized to programs’ specific transition activities.

CCWD chose text messaging because it appeared to be a low-cost approach that could support existing transition activities and provide a boost to ABS learners. The TPP project is an exciting opportunity to determine whether texting can be effective with ABS learners, and may be a promising approach for encouraging specific behaviors in learners preparing to go to college.

How did this project come into being?

The TPP project grew out of Abt’s and CCWD’s work together on an IES Researcher-Practitioner Partnership grant. This grant was a longitudinal study of Oregon’s Pathways for Adult Basic Skills Transition to Postsecondary Education and Work initiative. The findings from Abt’s analyses of adult learners’ GED® attainment and postsecondary participation prompted Oregon to want to try some additional strategies to encourage ABS learners to earn a secondary credential and enroll in postsecondary courses.

What is the current status of the project?

The study is underway, and transition facilitators are providing text messages to encourage adult learners to initiate and complete GED® testing, determine next steps, and begin the postsecondary planning process. The facilitators have found that while many treatment group learners respond to the texts, some learners have chosen to increase their face-to-face interaction with their facilitators. The facilitators report that texting is an efficient way to reinforce learners and check on their progress.

Why is this work important?

This research is particularly important because it is a rigorous test of an intervention that could be beneficial to adult basic skill learners nationwide and could leverage such programs’ existing activities in transitioning learners from basic skills programs to further education and training. We will learn more about the types of information and support that are most persuasive in helping learners succeed.