IES Blog

Institute of Education Sciences

What Are the Characteristics of Students Who Have Ever Been Suspended or Expelled From School?

By Lauren Musu-Gillette

Suspensions and expulsions from school are often associated with negative academic outcomes, such as lower levels of achievement and higher dropout rates.[i] Using data from the High School Longitudinal Study of 2009 (HSLS:2009), NCES recently published a new spotlight feature in Indicators of School Crime and Safety that shows that a greater percentage of students who are suspended or expelled have low engagement in school and are less academically successful.  

While there is a large body of research on this topic, this is the first time that the nationally representative HSLS study has been used to examine outcomes for and characteristics of suspended and expelled youth. The comparisons presented here cannot be used to establish a cause-and-effect relationship, but the longitudinal nature of the dataset could provide researchers an analytical path to understanding how these relationships have unfolded over time.

Research shows that students’ attitudes toward school are associated with their academic outcomes, and that schools with a supportive climate have lower rates of delinquency, including suspensions and expulsions.[ii] As part of the HSLS:2009 data collection, students reported on their school engagement[iii] and sense of school belonging[iv] in the fall of their ninth-grade year (2009). A greater percentage of students who were suspended or expelled between 2009 and 2012 were reported low school engagement entering high school. A similar pattern was seen with regard to a sense of belonging in school.


 Percentage of fall 2009 ninth-graders who were ever suspended or expelled through spring 2012, by school engagement and sense of school belonging: 2012
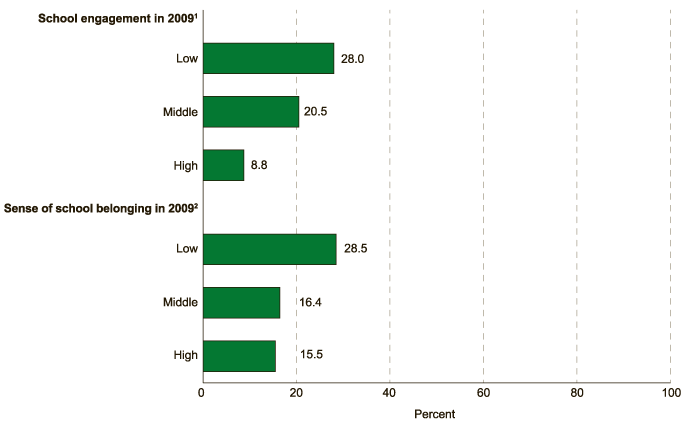
1A school engagement scale was constructed based on students' responses to questions about how frequently they went to class without homework done, without pencil or paper, without books, or late.

2A school belonging scale was constructed based on the extent to which students agreed or disagreed that they felt safe at school, that they felt proud of being part of the school, that there were always teachers or other adults at school they could talk to if they had a problem, that school was often a waste of time, and that getting good grades was important to them.

Source: U.S. Department of Education, National Center for Education Statistics, High School Longitudinal Study of 2009 (HSLS:2009).


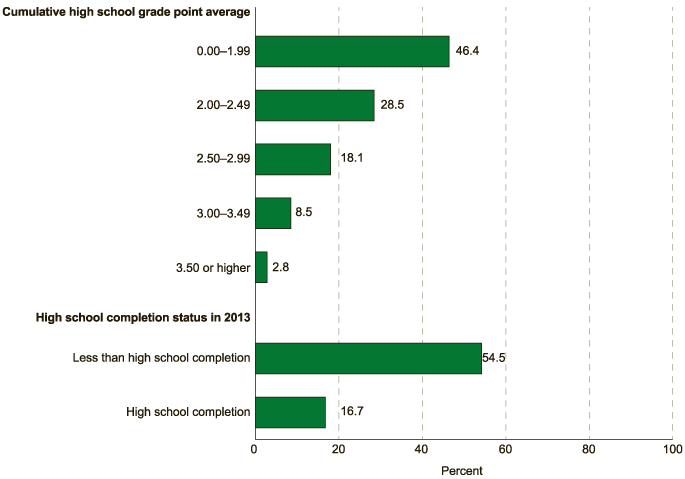
The percentages of students who had ever been suspended or expelled were higher for those students with lower grade point averages (GPAs). Nearly half of students with a cumulative high school GPA below 2.0 had ever been suspended or expelled and just 11 percent had a GPA of 3.0 or higher. Additionally, as of 2013, a higher percentage of students who had not completed high school than of students who had completed high school had ever been suspended or expelled (54 vs. 17 percent).


Percentage of fall 2009 ninth-graders who were ever suspended or expelled through spring 2012, by cumulative high school grade point average and high school completion status: 2013
Source: U.S. Department of Education, National Center for Education Statistics, High School Longitudinal Study of 2009 (HSLS:2009).


Differences in the demographic characteristics of students who had ever been suspended or expelled were similar to those found in other datasets, such as the Civil Rights Data Collection (CRDC). Characteristics of youth in the HSLS study who were ever suspended or expelled include:

  • A higher percentage of males (26 percent) than of females (13 percent) were ever suspended or expelled.
  • A higher percentage of Black students (36 percent) than of Hispanic (21 percent), White (14 percent), and Asian students (6 percent) had ever been suspended or expelled.
  • A higher percentage of students of Two or more races (26 percent) and Hispanic students had ever been suspended or expelled than White students.
  • A lower percentage of Asian students than of students of any other race/ethnicity with available data had ever been suspended or expelled.

For more information on the characteristics of students who have ever been suspended or expelled, please see the full spotlight in Indicators of School Crime and Safety 2015.


[i] Christle, C.A., Nelson, C.M., and Jolivette, K. (2004). School Characteristics Related to the Use of Suspension. Education and the Treatment of Children, 27(4): 509-526.; Skiba, R.J., Michael, R.S., Nardo, A.C., and Peterson, R.L. (2002). The Color of Discipline: Sources of Gender and Racial Disproportionality in School Punishment. Urban Review, 34(4): 317-342.

[ii] Morrison, G.M., Robertson, L., Laurie, B., and Kelly, J. (2002). Protective Factors Related to Antisocial Behavior Trajectories.Journal of Clinical Psychology, 58(3): 277-290; Christle, C.A., Jolivette, K., and Nelson, C.M. (2005). Breaking the School to Prison Pipeline: Identifying School Risk and Protective Factors for Youth Delinquency. Exceptionality, 13(2): 69-88.

[iii] School engagement measured how frequently students went to class without homework done, without pencil or paper, without books, or late.

[iv] Sense of school belonging was measured based on the extent to which students agreed or disagreed that they felt safe at school, that they felt proud of being part of the school, that there were always teachers or other adults at school they could talk to if they had a problem, that school was often a waste of time, and that getting good grades was important to them.

Number of Juvenile Offenders in Residential Placement Falls; Racial/Ethnic Gaps Persist

By Lauren Musu-Gillette and Joel McFarland

Juvenile offenders held in residential placement facilities often experience disruptions to their education as they pass in and out of traditional schooling. While most facilities provide middle- and high-school-level educational services, these services are generally not comparable to those available in their community schools.[i] Understanding the characteristics of juveniles in these facilities can help educators and policy-makers in finding the best ways to support education for these youth.  

Between 1997 and 2013, the number of youth in residential placement facilities fell by nearly 50 percent, from approximately 105,000 to just over 54,000.[ii] While the overall decline is informative, the residential placement rate (the number of juvenile offenders in residential facilities per 100,000 youth in the general population) provides a more comparable measurement across time because it accounts for population growth and demographic changes. The overall residential placement rate fell from 356 per 100,000 youth in 1997 to 173 per 100,000 in 2013. Following this trend, the residential placement rate for youth in various racial and ethnic subgroups also fell significantly as seen in the chart below.


Residential placement rate (number of juvenile offenders in residential placement facilities) per 100,000 juveniles, by race/ethnicity: Selected years, 1997 through 2013

Source: U.S. Department of Justice, Office of Juvenile Justice and Delinquency Prevention, Census of Juveniles in Residential Placement (CJRP).


Although residential placement rates declined for all racial/ethnic groups, disparities between racial/ethnic groups persist. In 2013, the residential placement rate for Black youth was 4.6 times the rate for White youth, and the rate for Hispanic youth was 1.7 times the rate for White youth. The American Indian/Alaska Native rate was 3.3 times the White rate, and the residential placement rate for Asian/Pacific Islander youth was approximately one-quarter of the rate for White youth (0.28).

The residential placement rate per 100,000 youth was also higher for Black males than for males or females of any other racial/ethnic group. Overall, Black males made up over one-third (35 percent) of all youth in residential placement in 2013. The rate of residential placement for Black males in 2013 was 804 per 100,000, which was 1.6 times the rate for American Indian/Alaska Native males, 2.7 times the rate for Hispanic males, 5 times the rate for White males, and more than 16 times the rate for Asian/Pacific Islander males.

While residential placement rates were lower for females than males from all racial/ethnic groups, there were also differences between racial/ethnic groups for females. The residential placement rate was highest for American Indian/Alaska Native females. This rate was 3.7 times the rate for Hispanic females, 4.8 times the rate for White females, and over 20 times the rate for Asian/Pacific Islander females. The rate for Black females was also more than twice the rate for Hispanic, White, and Asian/Pacific Islander females.


Residential placement rate (number of juvenile offenders in residential placement facilities) per 100,000 juveniles, by race/ethnicity and sex: 2013

Source: U.S. Department of Justice, Office of Juvenile Justice and Delinquency Prevention, Census of Juveniles in Residential Placement (CJRP).


Older youth made up a greater share of juveniles in residential placement than younger youth in 2013. A majority (69 percent) of juveniles in residential facilities were between the ages of 16 and 20; about 30 percent were between the ages of 13 and 15; and just 1 percent were age 12 or younger.

For more information on juvenile offenders in residential placement facilities, including data on the characteristics of those facilities, please see the full spotlight in Indicators of School Crime and Safety 2015.


[i] Hockenberry, S., Sickmund, M., and Sladky, A. (2013). Juvenile Residential Facility Census, 2010: Selected Findings. Washington, DC: Office of Juvenile Justice and Delinquency Prevention, U.S. Department of Justice. Retrieved November 2015 from http://www.ojjdp.gov/pubs/241134.pdf; The Council of State Governments Justice Center. (2015). Locked Out: Improving Educational and Vocational Outcomes for Incarcerated Youth. New York: Author. Retrieved November 2015 from https://csgjusticecenter.org/youth/publications/locked-out-improving-educational-and-vocational-outcomes-for-incarcerated-youth/.

[ii] Data presented here come from the Census of Juveniles in Residential Placement (CJRP). The CJRP is a biennial survey of all secure and nonsecure residential placement facilities that house juvenile offenders, defined as persons younger than 21 who are held in a residential setting as a result of some contact with the justice system (i.e., being charged with or adjudicated for an offense). The CJRP provides a 1-day count of the number of youth in residential placement, as well as data on the characteristics of youth in these facilities and information about the facilities themselves.

My Brother’s Keeper: Using data to measure the educational progress of boys and young men of color

By Grace Kena

In February 2014, President Obama launched My Brother’s Keeper. This effort was designed to promote opportunity for and to unlock the full potential of the nation’s young people, including boys and young men of color, with help from government agencies, community leaders, private philanthropies, and businesses. As part of this initiative, federal agencies were asked to improve the accessibility of data that highlight both the challenges and the accomplishments of young people in progressing through the education system and entering the labor force. These statistics provide a composite view of recent trends for males and females across a variety of key dimensions.

Academic performance gaps in learning behaviors, knowledge, and skills, among children in various racial/ethnic groups are found as early as infancy,[1] preschool, and kindergarten[2]. In addition, children from lower-income families tend to have poorer educational outcomes than their peers from more well- off families, and relatively high percentages of males and females of color live in poverty. The latest data show that among 12th graders, the average reading and mathematics assessment scores for Black, Hispanic, and American Indian/Alaska Native 12th-graders were lower than the average scores for their peers. In addition, the percentage of Hispanic 18- to 24-year-olds who had not completed high school was higher than the average percentage. The percentages of Black, Hispanic, and American Indian/Alaska Native young men in this age group who were enrolled in college were also lower than the average, and the percentages of Black and Hispanic young men ages 25–29 who had earned a bachelor’s or higher degree were lower than the average for young men in this age group.

On the other hand, young people are making progress in education. For example, average mathematics scores increased between 2005 and 2013 for all male students as well as for Black and Hispanic students overall. The percentage of males ages 18–24 who had not completed high school decreased from 2000 to 2014 for most racial/ethnic groups, and the decreases for Black and Hispanic young men were among the largest. In addition, the percentages of Black and Hispanic young men in this age group who were enrolled in college increased from 2000 to 2013.


Percentage of male 18- to 24-year-olds enrolled in 2- and 4-year colleges, by race/ethnicity: 2000 and 2013

Figure. Percentage of 18- to 24-year-olds enrolled in 2- and 4-year colleges, by race/ethnicity and sex: 2013

! Interpret data with caution. The coefficient of variation (CV) for this estimate is between 30 and 50 percent.

SOURCE: U.S. Department of Commerce, Census Bureau, Current Population Survey, 2013. 


More education data from the My Brother’s Keeper initiative can be found in the feature in The Condition of Education 2015, and on the My Brother’s Keeper data site. Information on changes to existing programs and the creation of new public-private partnerships designed to meet the needs of young people are available on the White House site. You can also learn more about the findings from the video below:

This blog was originally posted on June 24, 2015 and was updated on August 6, 2015

[1] National Center for Education Statistics. The Condition of Education 2009, Indicators 2 and 3. 

[2] Federal Interagency Forum on Child and Family Statistics. America’s Children: Key National Indicators of Well-Being, 2013. Washington, DC: U.S. Government Printing Office.