The average reading score for U.S. 4th- and 8th-grade students decreased between 2017 and 2019. Changes in mathematics scores were mixed during this period, with an increase at grade 4 and a decrease at grade 8. These data are from the National Assessment of Educational Progress (NAEP)—also known as The Nation’s Report Card. NAEP is the largest nationally representative and continuing assessment of what students in the United States know and can do in various subject areas and is frequently referred to as the “gold standard” of student assessments.
In 4th-grade reading, the average scale score in 2019 was 220, one point lower than in 2017 (figure 1). In 8th-grade reading, the average scale score was 263, three points lower than in 2017 (figure 2). Compared with a decade ago in 2009, the 2019 average reading scale scores at each grade were not significantly different, but they were higher than the scale scores in 1992, the first time the reading assessment was administered.
Figure 1. Average National Assessment of Educational Progress (NAEP) reading scale scores of 4th-grade students: Selected years, 1992–2019
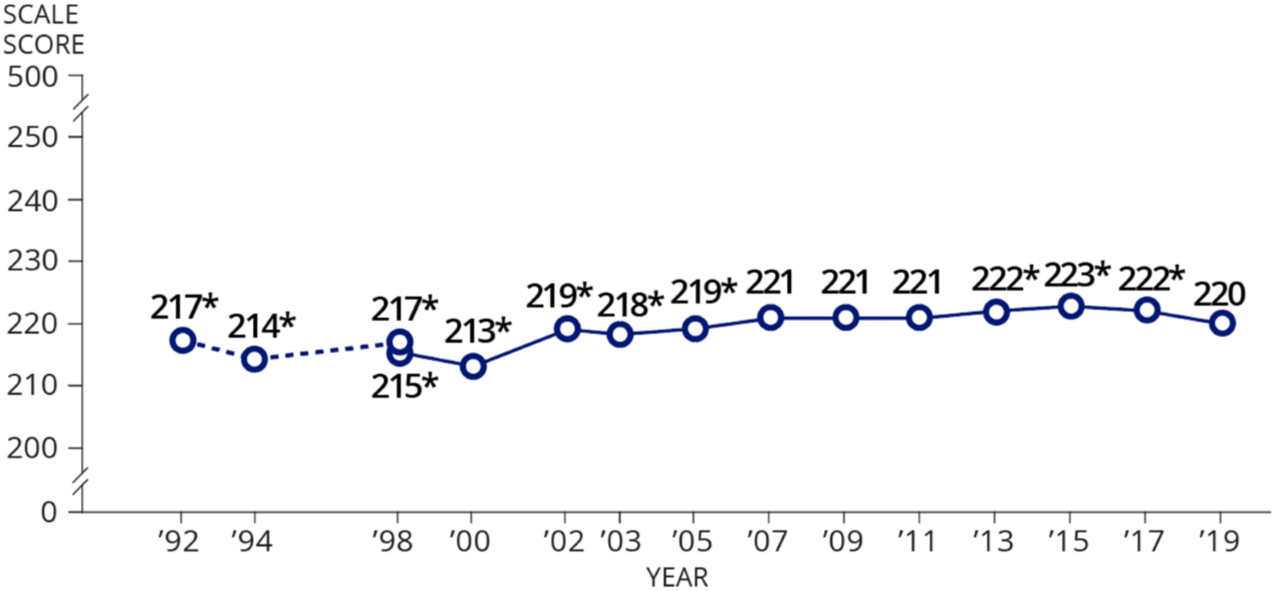
* Significantly different (p < .05) from 2019
--- Accommodations not permitted
— Accommodations permitted
Figure 2. Average National Assessment of Educational Progress (NAEP) reading scale scores of 8th-grade students: Selected years, 1992–2019
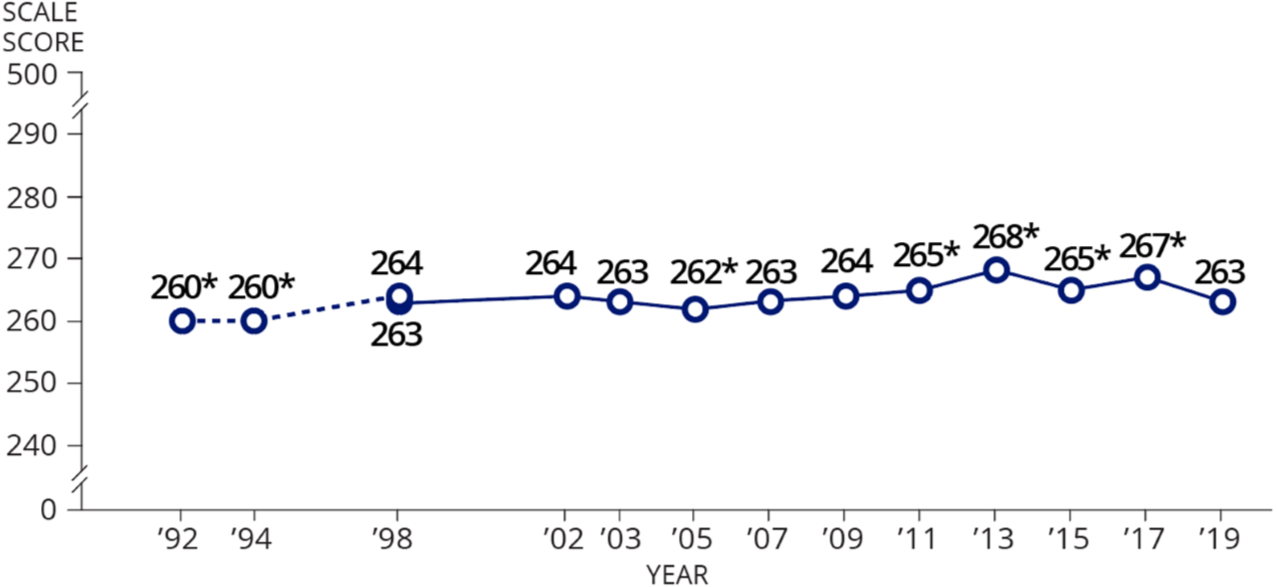
* Significantly different (p < .05) from 2019
--- Accommodations not permitted
— Accommodations permitted
In 4th-grade mathematics, the average scale score in 2019 was 241, one point higher than in 2017 (figure 3). In 8th-grade mathematics, the average scale score in 2019 was 282, one point lower than in 2017 (figure 4). Like reading, average scale scores for mathematics at both grades in 2019 were not significantly different than in 2009. Mathematics scale scores for both grade were higher in 2019 than in 1990, the first time the mathematics assessments were administered.
Figure 3. Average National Assessment of Educational Progress (NAEP) mathematics scale scores of 4th-grade students: Selected years, 1990–2019
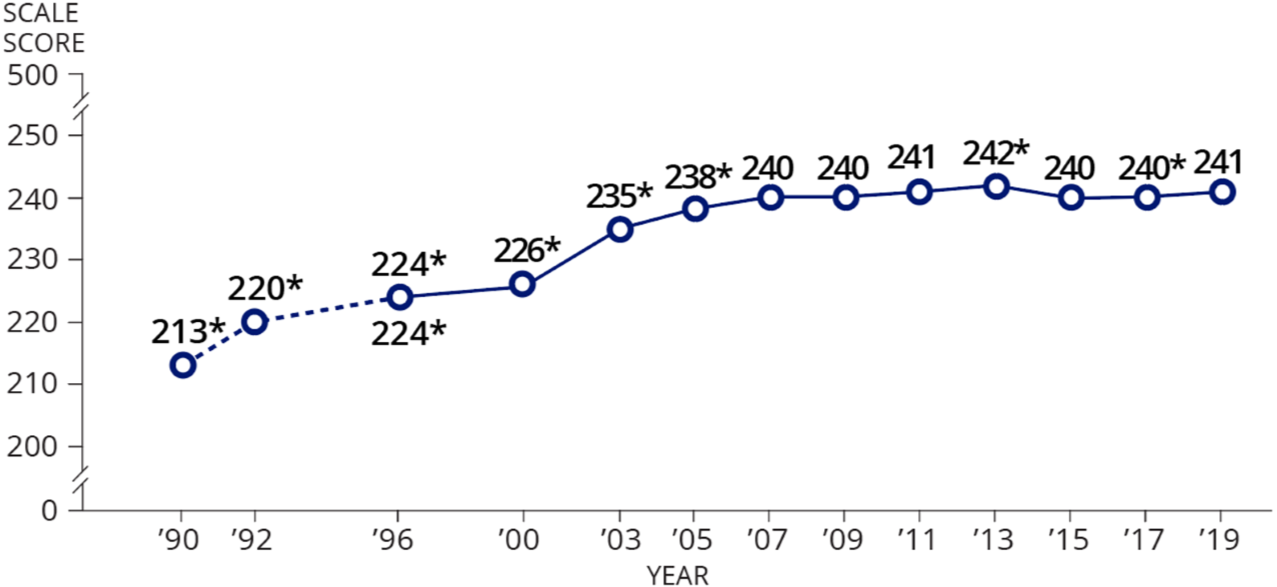 * Significantly different (p < .05) from 2019
--- Accommodations not permitted
— Accommodations permitted
Figure 4. Average National Assessment of Educational Progress (NAEP) mathematics scale scores of 8th-grade students: Selected years, 1990–2019
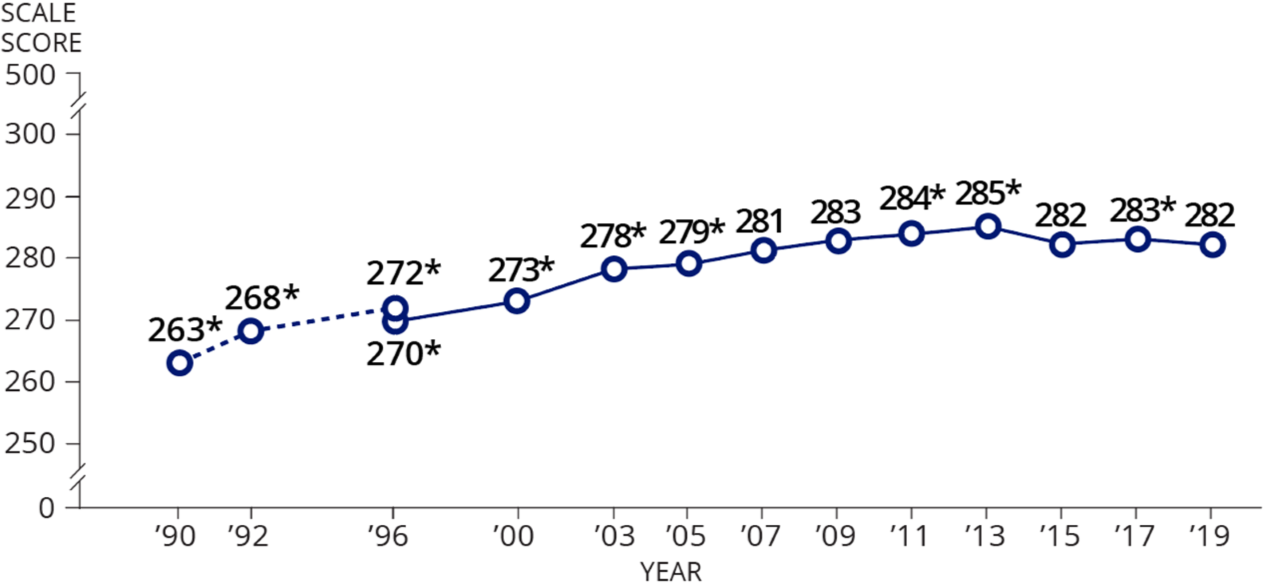
* Significantly different (p < .05) from 2019
--- Accommodations not permitted
— Accommodations permitted
The Nation’s Report Card also presents data by different demographic groups—such as race/ethnicity—gender, school type, and region. White and Black 4th- and 8th-grade students scored lower in reading in 2019 than in 2017. Hispanic and American Indian/Alaska Native 8th-grade students also scored lower in reading in 2019 than in 2017. In mathematics, 4th-grade Hispanic students scored higher in 2019 than in 2017, and 8th-grade American Indian/Alaska Native students scored lower in 2019 than in 2017. From 2017 to 2019, males’ scores increased in mathematics at grade 4 but decreased in reading at both grades.
NCES administered the 2019 NAEP mathematics and reading assessments to almost 600,000 4th- and 8th-graders in public and private schools in all 50 states, the District of Columbia, the U.S. Department of Defense schools, and 27 urban districts. Samples of schools and students are drawn from each state and from the District of Columbia and Department of Defense schools.
Visit https://nces.ed.gov/nationsreportcard/ to view the report.