IES Blog

Institute of Education Sciences

Distance Education in College: What Do We Know From IPEDS?

Distance education (DE) is defined by the Integrated Postsecondary Education Data System (IPEDS) as “education that uses one or more technologies to deliver instruction to students who are separated from the instructor.” By allowing students to take classes online in their own locations and on their own schedules, DE has increased access to college. Since the beginning of the coronavirus pandemic in spring 2020, DE has become an important way to deliver college classes while helping to keep students safe.

IPEDS collects information on DE in four of its surveys: Institutional Characteristics, Fall Enrollment, Completions, and, most recently, 12-Month Enrollment. The figures below present key statistics on DE course/program offerings and enrollments at U.S. colleges.

How many colleges offer distance education courses and programs?

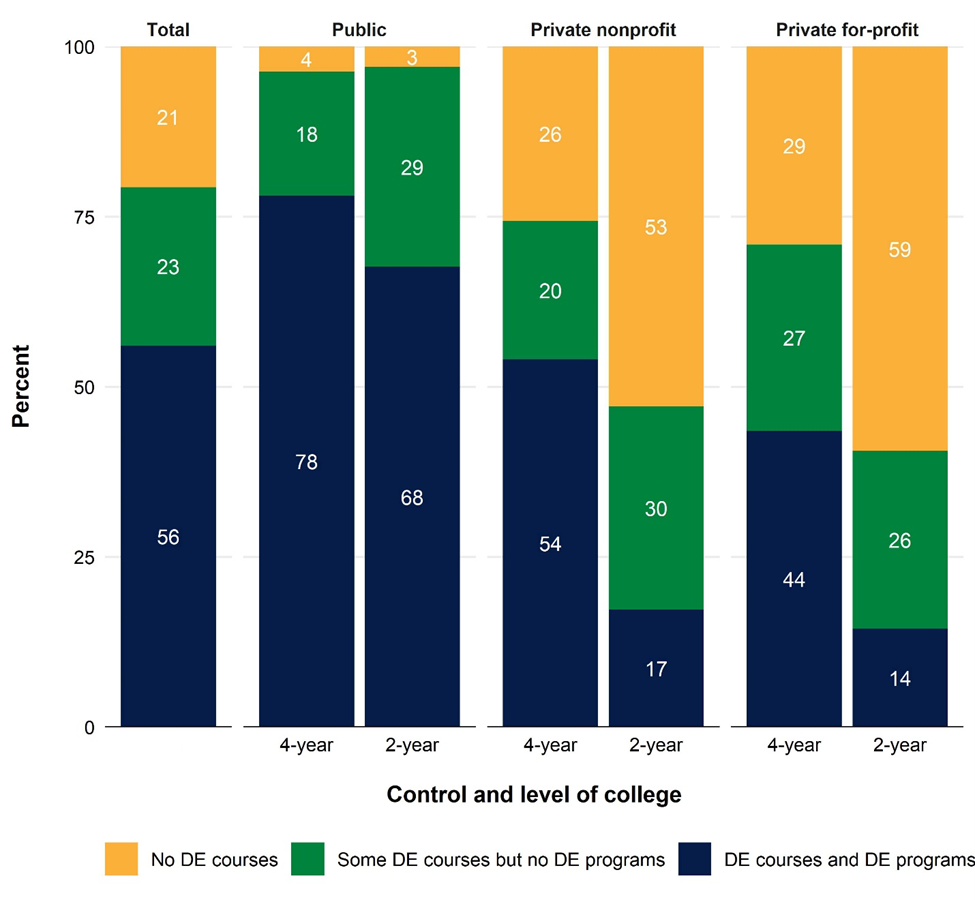
In 2018–19, most colleges (79 percent) offered either stand-alone DE courses or entire DE programs (e.g., 100% online degrees). DE course and program offerings differed by the control (public, private nonprofit, or private for-profit) and level (4-year or 2-year) of the college.

  • Almost all public 4- and 2-year colleges (96 and 97 percent, respectively) offered either DE courses or DE programs.
  • A majority of private nonprofit and for-profit 2-year colleges (53 and 59 percent, respectively) did not offer DE courses or DE programs, though they account for a small number of colleges.

Figure 1. Percentage distribution of colleges, by control, level, and distance education (DE) offerings of college: Academic year 2018–19
NOTE: Figure includes U.S. degree-granting institutions that participate in Title IV federal financial aid programs. Although rounded numbers are displayed, the figures are based on unrounded data. Detail may not sum to totals because of rounding.

SOURCE: U.S. Department of Education, National Center for Education Statistics, Integrated Postsecondary Education Data System (IPEDS) Institutional Characteristics component, Fall 2018.


How many students are enrolled in distance education courses?

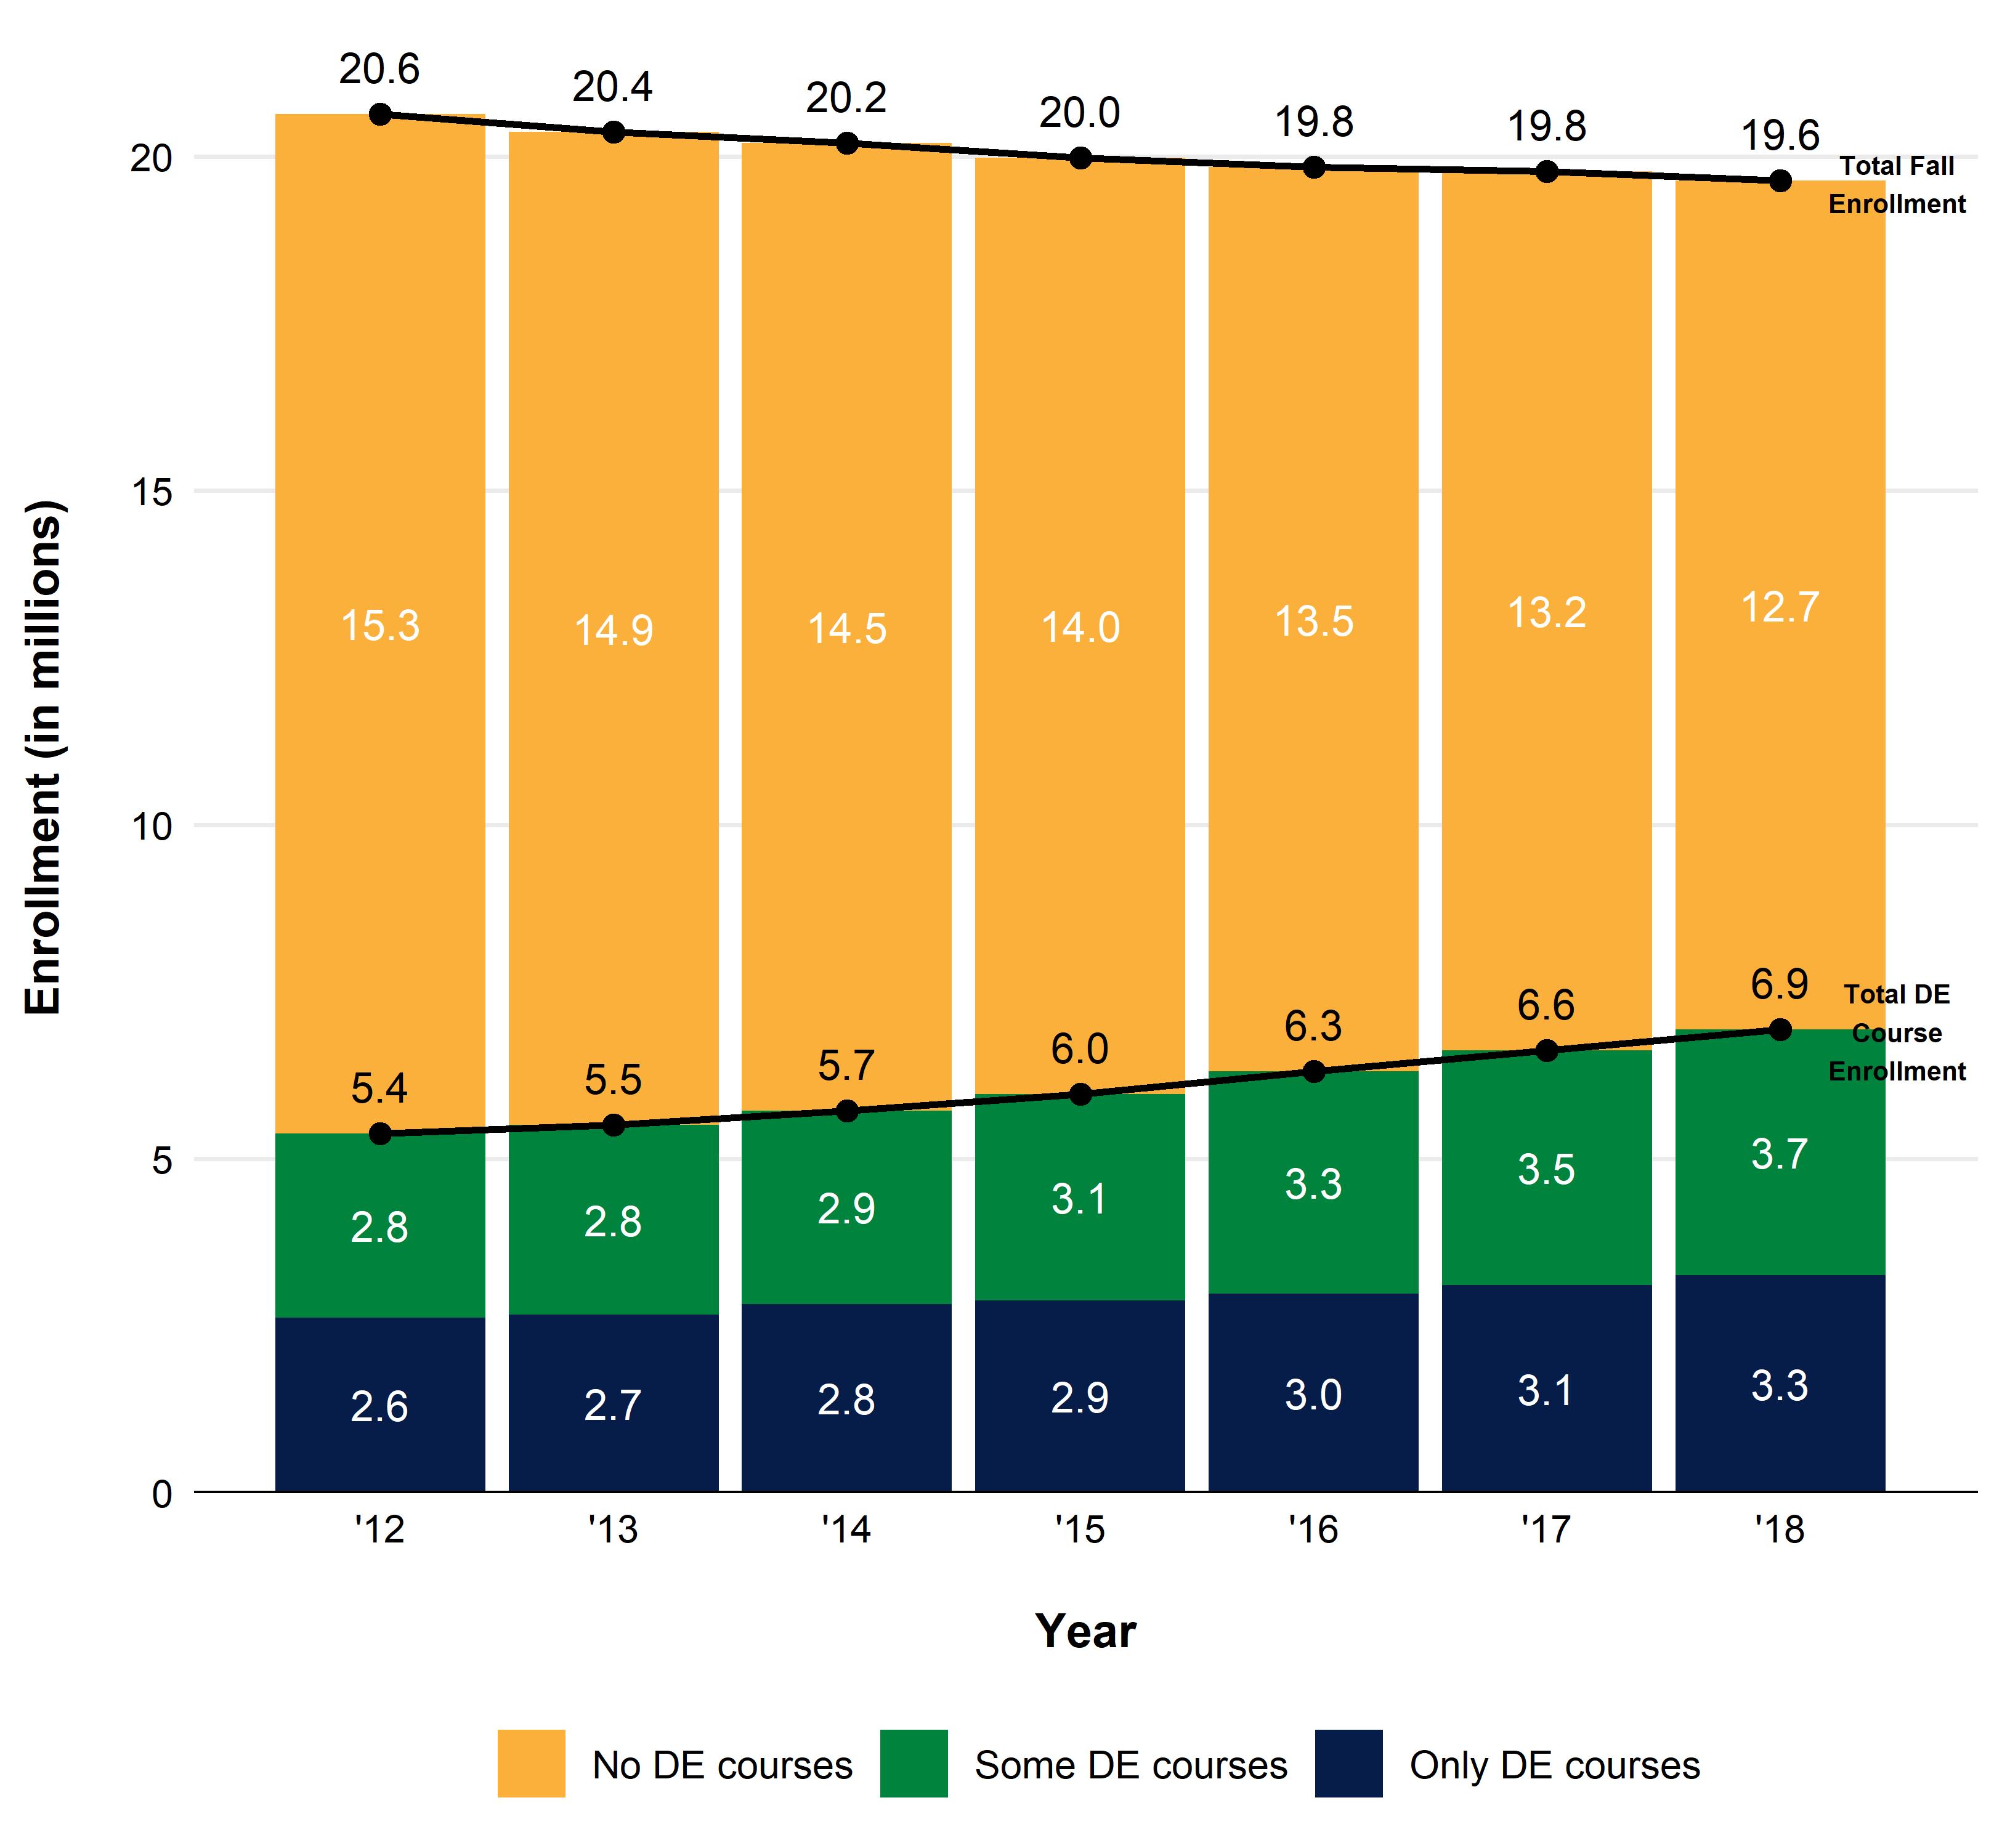
In fall 2018, about 6.9 million students enrolled in DE courses, or 35 percent of the total fall enrollment population (19.6 million).

  • Between fall 2012 and 2018, DE course enrollment increased 29 percent (from 5.4 to 6.9 million), while total fall enrollment declined by 5 percent (from 20.6 to 19.6 million).
  • The number of students enrolled in a mix of DE and face-to-face courses increased by 33 percent (from 2.8 to 3.7 million) between fall 2012 and 2018. The number of students enrolled in only DE courses also increased, but at a slower rate of 24 percent (from 2.6 to 3.3 million).

Figure 2. Total college enrollment, by distance education (DE) participation of students: Fall 2012 through fall 2018
NOTE: Figure includes U.S. degree-granting institutions that participate in Title IV federal financial aid programs. Although rounded numbers are displayed, the figures are based on unrounded data.

SOURCE: U.S. Department of Education, National Center for Education Statistics, Integrated Postsecondary Education Data System (IPEDS) Fall Enrollment component, Spring 2013 through Spring 2019.


How does enrollment in distance education courses vary by college control?

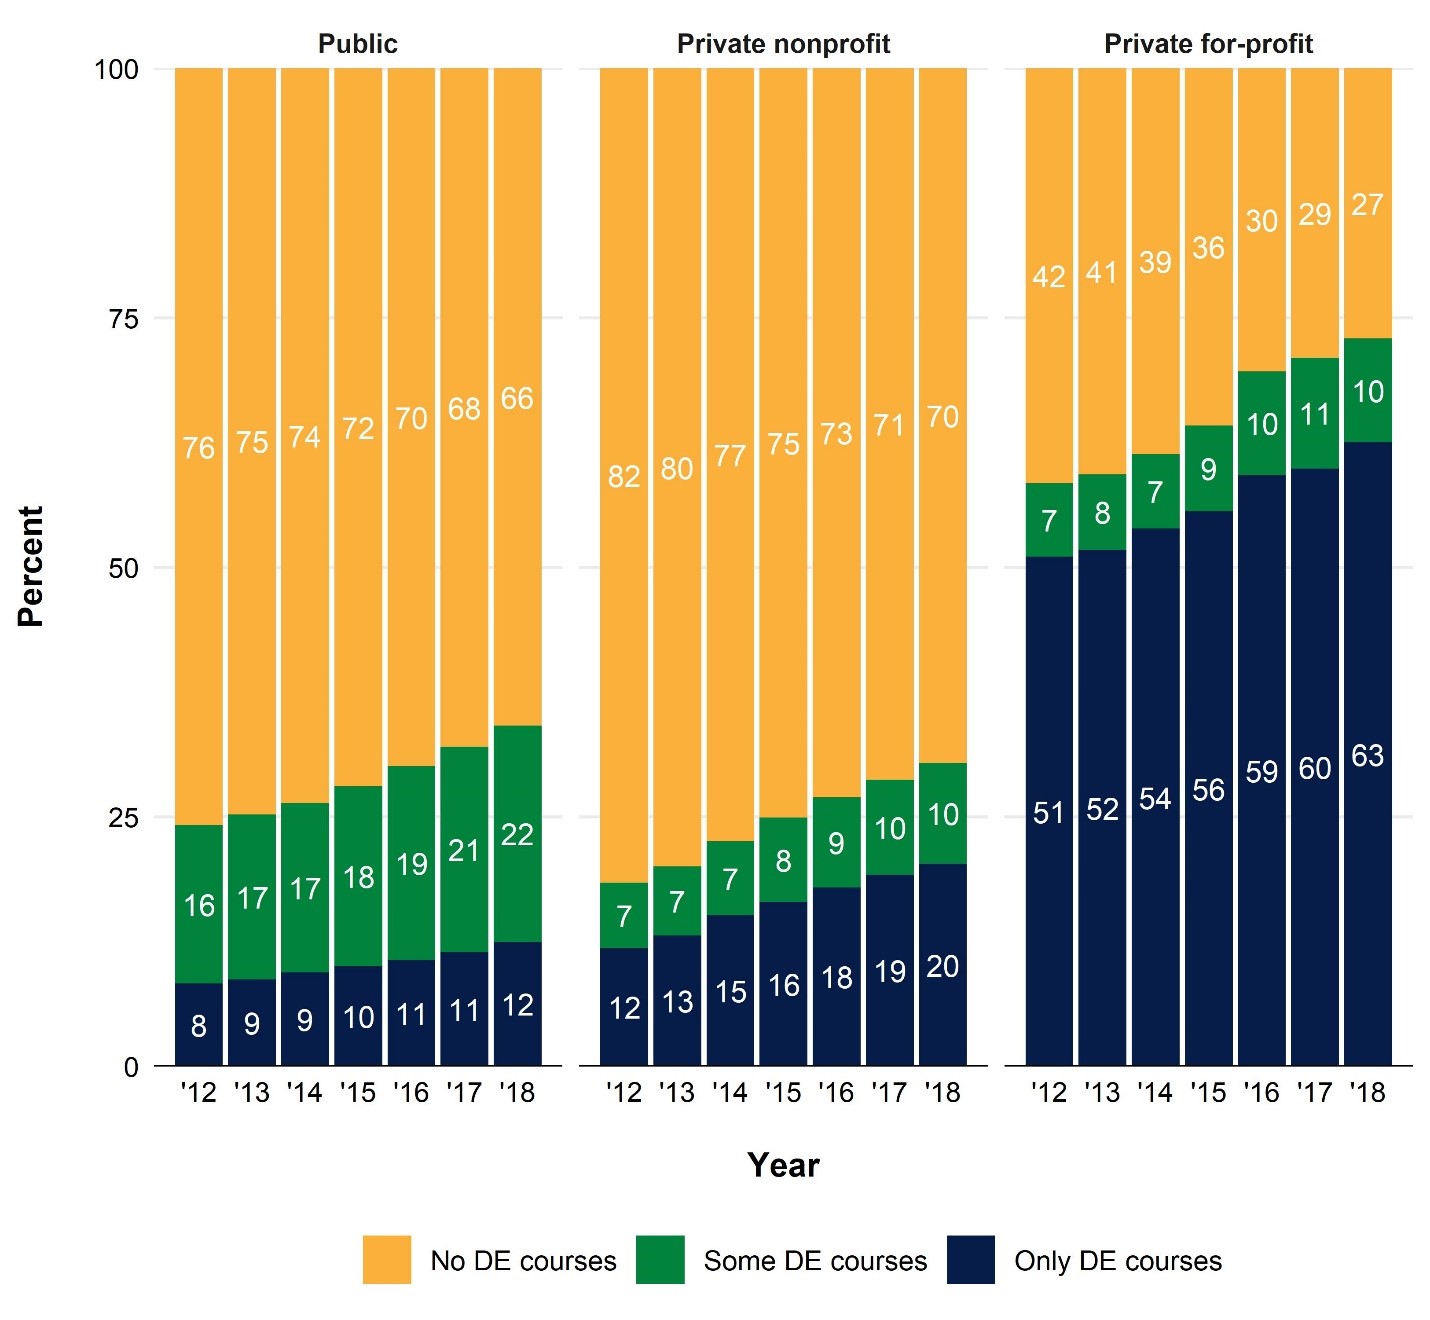
In fall 2018, the share of students enrolled in DE courses differed by control of the college.

  • About one-third of students at public and private nonprofit colleges enrolled in at least one DE course (34 and 30 percent, respectively).
  • At public colleges, students were more likely to enroll in a mix of DE and face-to-face courses (22 percent) than in only DE courses (12 percent). This trend reversed at private nonprofit colleges, with 10 percent of students enrolled in a mix of DE and face-to-face courses and 20 percent in only DE courses.
  • At private for-profit colleges, most students (73 percent) enrolled in at least one DE course (10 percent in a mix of DE and face-to-face courses and 63 percent in only DE courses).

Figure 3. Percentage distribution of college enrollment, by control of college and distance education (DE) participation of students: Fall 2012 through fall 2018
NOTES: Figure includes U.S. degree-granting institutions that participate in Title IV federal financial aid programs. Although rounded numbers are displayed, the figures are based on unrounded data. Detail may not sum to totals because of rounding.

SOURCE: U.S. Department of Education, National Center for Education Statistics, Integrated Postsecondary Education Data System (IPEDS) Fall Enrollment component, Spring 2013 through Spring 2019.


Among students enrolled in only DE courses, where do they live relative to their colleges?

Students taking only DE courses do not necessarily live far away from their colleges (even when physically coming to campus is generally not required), especially among students enrolled in public colleges.

  • In fall 2018, most (82 percent) of the 1.8 million students taking only DE courses at public colleges lived in the same state as their colleges. Only 15 percent lived in a different state.
  • At private nonprofit and for-profit colleges, students taking only DE courses were less likely to live in the same state as their colleges (35 percent and 17 percent, respectively) and more likely to live in a different state (63 percent and 81 percent, respectively) in fall 2018.

Figure 4. Percentage distribution of college enrollment for students enrolled in only distance education (DE) courses, by control of college and location of students: Fall 2018

NOTE: One square represents 1 percent. “State unknown” is reported by the institution when a student’s home state of residence cannot be determined; “Location unknown” is imputed by IPEDS to classify students when the institution does not report any residence status. Figure includes U.S. degree-granting institutions that participate in Title IV federal financial aid programs.

SOURCE: U.S. Department of Education, National Center for Education Statistics, Integrated Postsecondary Education Data System (IPEDS) Fall Enrollment component, Spring 2019.


The DE enrollment figures above use the most recent IPEDS data available, which is limited to a fall “snapshot” date. However, in 2020–21, IPEDS expanded the 12-Month Enrollment survey to collect DE course enrollment for the entire 12-month academic year, which will provide even more information on DE enrollments at U.S. colleges. The first 12-month DE enrollment data, representing the 2019–20 academic year, will be released in spring 2021. These will be the first IPEDS enrollment data to overlap with the coronavirus pandemic, and DE course enrollments are expected to increase.

To learn more about DE data collected in IPEDS, visit the Distance Education in IPEDS resource page. To explore IPEDS data through easy-to-use web tools or to access data files to conduct your own original analyses like the ones presented in this blog, visit the IPEDS Use the Data page.


By Roman Ruiz and Jie Sun, AIR

New Project Exploring Adult Basic Skills in STEM-Related Postsecondary CTE®

In celebration of CTE® (career and technical education) month, we would like to highlight the launch of an NCER project that aims to help us understand how to best support adults seeking additional CTE education and training.

Through their exploratory project, Literacy, Numeracy, and Problem-Solving Skills in Technology-Rich Environment in the STEM-Related Subbaccalaureate Programs in the United States, researchers will use a mixed-method design to gather information about the distribution of basic skills (literacy, numeracy, and problem solving) for adults in STEM occupations and students enrolled in STEM-related sub-baccalaureate programs at community colleges. Their goal is to help identify the needs of students and the programming practices at community colleges that may promote basic skill development in STEM programs.

The team will be leveraging data from the Program for the International Assessment of Adult Competencies (PIAAC) to survey the distribution of skills and abilities across a nationally representative sample of adults in STEM fields. They will also be collecting primary data from adults and programs in multiple locations, including Indiana, Ohio, and Washington states.


To help inform the public about their project, the researchers have created a short YouTube video for the public. This project began in July 2020 and may have initial results ready as early as late 2021.


Written by Meredith Larson (Meredith.Larson@ed.gov), Program Officer for Postsecondary and Adult Education, NCER.

Exploring How COVID-19 Affects Learning and Critical Thinking

Our nation continues to navigate a unique and challenging year due to the COVID-19 pandemic. In our first blog post in this series, we highlighted how educators, students, families, and researchers are adapting while trying to engage in opportunities to support learning. COVID-19 has created numerous challenges in education research with many studies needing to be modified or put on hold. At the same time, new research questions arise focusing on the impact of the pandemic on student learning, engagement, and achievement. Here, we highlight two IES-funded projects that are conducting timely and relevant research exploring the impact of COVID-19 on learning and critical thinking.    

Guanglei Hong, Lindsey Richland, and their research team at University of Chicago and University of California, Irvine have received supplemental funds to build off their current grant, Drawing Connections to Close Achievement Gaps in Mathematics. The research team will conduct a study during the 2020-21 school year to explore the relationship between student anxiety about the health risks associated with COVID-19 and their math learning experiences. They predict that pressure and anxiety, like that induced by COVID-19, use the same executive function resources that students need to engage in higher order thinking and reasoning during math instruction, which negatively affects the ability to learn. Through this study, the research team will also test whether particular instructional approaches reduce the effects of pressure and anxiety on learning. These findings will be useful for teachers and students in the near term as they navigate the COVID-19 pandemic and longer term for students who experience anxiety due to a variety of other reasons.

In addition, IES has funded an unsolicited grant to Clarissa Thompson at Kent State University to investigate whether an education intervention aimed at decreasing whole number bias errors can help college-aged students and adults more accurately interpret health statistics about COVID-19. During the COVID-19 pandemic, the public receives daily updates about the number of people locally, nationally, and globally who are infected with and die from COVID-19. Beliefs about the risk of getting a disease is a key predictor of engagement in prevention behaviors. Understanding the magnitude of one’s risk may require making sense of numerical health information, often presented in the form of rational numbers, such as fractions, whole number frequencies, and percentages. An intervention to decrease whole number bias errors and improve understanding of rational numbers has the immediate and pressing benefit of being able to accurately reason about the risk of COVID-19 and other health risks. This skill is also critical for success in science, technology, engineering, and mathematics (STEM) fields.

Both of these projects offer opportunities to better understand learning and critical thinking in the midst of the pandemic. They will also provide the field with generalizable information about ways to improve learning in STEM fields. Stay tuned for more COVID-19 related education research discussions as we continue this series on our blog.


Written by Christina Chhin (christina.chhin@ed.gov) and Erin Higgins (erin.higgins@ed.gov), National Center for Education Research (NCER).

This is the third in a series of blog posts focusing on conducting education research during COVID-19. Other blog posts in this series include Conducting Education Research During COVID-19 and Measuring Attendance during COVID-19: Considerations for Synchronous and Asynchronous Learning Environments.


Conducting Education Research During Covid-19

Since the start of the pandemic, we have all heard about the unprecedented changes to schooling in the U.S. and the ways that educators, students, and families have been adapting to the new reality.

Education researchers have also been adapting their work due to school closings, canceled testing, and different school reopening plans in the 2020-21 school year.

How have education researchers handled the new reality?

Some researchers have been busy compiling and disseminating research findings to support districts and schools to continue instruction during the pandemic. For example, evidence-based recommendations were made available to help parents and schools pivot to a virtual environment (from very young children up to the postsecondary level), maintain engagement, address mental health (including in rural areas), protect against learning loss, and decide how to prioritize needs when considering re-opening. And many education technology researchers and developers have provided online resources to schools.

Other researchers have been working hard to understand the overall disruption to schooling due to COVID-19 and the ramifications on student learning around the world.  For example, there have been efforts to keep track of school closures, document what is happening in schools across the country (including in rural districts), study the switch to online learning and attend to unequal access to technology for remote learning, forecast funding scenarios, and examine changes in teacher recruitment.

In addition, education researchers are thinking about new ways to conduct research in light of the changes to schooling. They are looking at alternatives to standardized testing, new approaches to teaching and learning to strengthen schools moving forward, and ways to rebuild our education systems after the pandemic. Indeed, there are myriad ways that education researchers can and are using their skills to continue to support education during this unprecedented time.

How has COVID-19 impacted IES-funded education research studies?

IES realizes that the pandemic has changed things in ways that may complicate education research – both how it is conducted and how it is interpreted. So, we are actively working with grantees to help ensure the integrity of their work and to respond to the needs, interests, and concerns of the schools and colleges they are working with and the communities they are trying to help. In a follow-up to an IES-funded study on students in foster care, a researcher-practitioner partnership in Colorado is examining the implications of challenging circumstances such as COVID-19 on the postsecondary education of vulnerable youth.

Many IES-funded researchers have had to alter their research plans to accommodate the needs of their partner schools and overcome the challenges posed by the abrupt transition to virtual learning. Because of continued uncertainty, they may need to change plans again. Program officers at IES have been working with grantees on a case-by-case basis to adapt their timelines and, in some cases, their research designs.

IES’s priority is to help researchers maintain scientific rigor while holding a realistic view of what can and cannot be done this year. As we work with our grantees, we take into consideration where the project is in its overall timeline. For example, if the project has collected all of its data and is in the final analysis stage, the remaining work may not be affected. Or, if a project has not yet started to begin an intervention in schools, it can pause during the 2020-2021 academic school year and resume in 2021-2022. Still, other projects may find themselves unable to either continue or pause. These projects may not be able to achieve their initial purpose and may need to end.

Despite some of the challenges, the pandemic offers a unique natural experiment for learning and instruction, as well as opportunities for innovation that can ultimately benefit education. IES, our funded researchers, and the communities that rely on research evidence continue to pull in the same direction: building strong evidence to inform policy and practice. Through collaboration and dialog, we will work together to ensure that data and results are meaningful, valid, and as timely as possible. IES will continue to focus on high-quality education research to improve student learning and achievement both now and in the future.

Stay tuned for future blog posts on what our researchers are doing to address some of the challenges that face educators, families, and policymakers during this unprecedented time!


Written by Corinne Alfeld (Corinne.Alfeld@ed.gov), National Center for Education Research.  

Cost Analysis in Practice (CAP) Project Provides Guidance and Assistance

In 2020, as part of a wider IES investment in resources around cost, IES funded the Cost Analysis in Practice (CAP) Project, a 3-year initiative to support researchers and practitioners who are planning or conducting a cost analysis of educational programs and practices. The CAP Project Help Desk provides free on-demand tools, guidance, and technical assistance, such as support with a cost analysis plan for a grant proposal. After inquiries are submitted to the Help Desk, a member of the CAP Project Team reaches out within two business days. Below is a list of resources that you can access to get more information about cost analysis.


STAGES FOR CONDUCTING A COST ANALYSIS


CAP Project Resources

Cost Analysis Standards and Guidelines 1.0: Practical guidelines for designing and executing cost analyses of educational programs.

IES 2021 RFAs Cost Analysis Requirements: Chart summarizing the CAP Project’s interpretation of the IES 2021 RFAs cost analysis requirements.

Cost Analysis Plan Checklist: Checklist for comprehensive cost analysis plans of educational programs and interventions.

Introduction to Cost Analysis: Video (17 mins).


General Cost Analysis Resources

The Critical Importance of Costs for Education Decisions: Background on cost analysis methods and applications.

Cost Analysis: A Starter Kit: An introduction to cost analysis concepts and steps.

CostOut®: Free IES-funded software to facilitate calculation of costs once you have your ingredients list, includes database of prices.

DecisionMaker®: Free software to facilitate evidence-based decision- making using a cost-utility framework.

Cost-Effectiveness Analysis of Early Reading Programs: A Demonstration With Recommendations for Future Research: Open access journal article.


*More resources available here.


The content for this blog has been adapted from the Cost Analysis in Practice Project informational flyer (CAP Project, 2020) provided by the CAP Project Team. To contact the CAP Help Desk for assistance, please go to https://capproject.org/. You can also find them on Twitter @The_CAP_Project.