Part 2 of the National Teacher and Principal Survey (NTPS) blog series for American Education Week (AEW) is dedicated to public school teachers in recognition of their significant influence on the educational experiences of students in their classrooms (read part 1 here).
The NTPS collects information directly from public and private school teachers and principals to provide a picture of education in the United States from their perspective. Data from the 2017–18 NTPS can be viewed by state (using the NTPS State Dashboard), allowing public school teachers and principals to compare data from their state to those of their colleagues in other states across the country (note that these data were collected prior to the coronavirus pandemic). NCES and the Census Bureau are currently interviewing schools, principals, and teachers for the 2020–21 NTPS. When the data collection is complete, we will be able to look at changes over time, including changes between experiences before the pandemic and current experiences, both within and across states.
A few highlighted teacher and principal characteristics from the 2017–18 NTPS can be found below.
AEW Day 4: U.S. Public School Teachers’ Experiences (2017–18 NTPS)
- Nearly three-quarters (72 percent) of public school teachers strongly or somewhat disagreed with the statement “the stress and disappointments involved in teaching at this school aren’t really worth it,” compared with about a quarter (28 percent) of teachers who strongly or somewhat agreed. These data are also available by state.
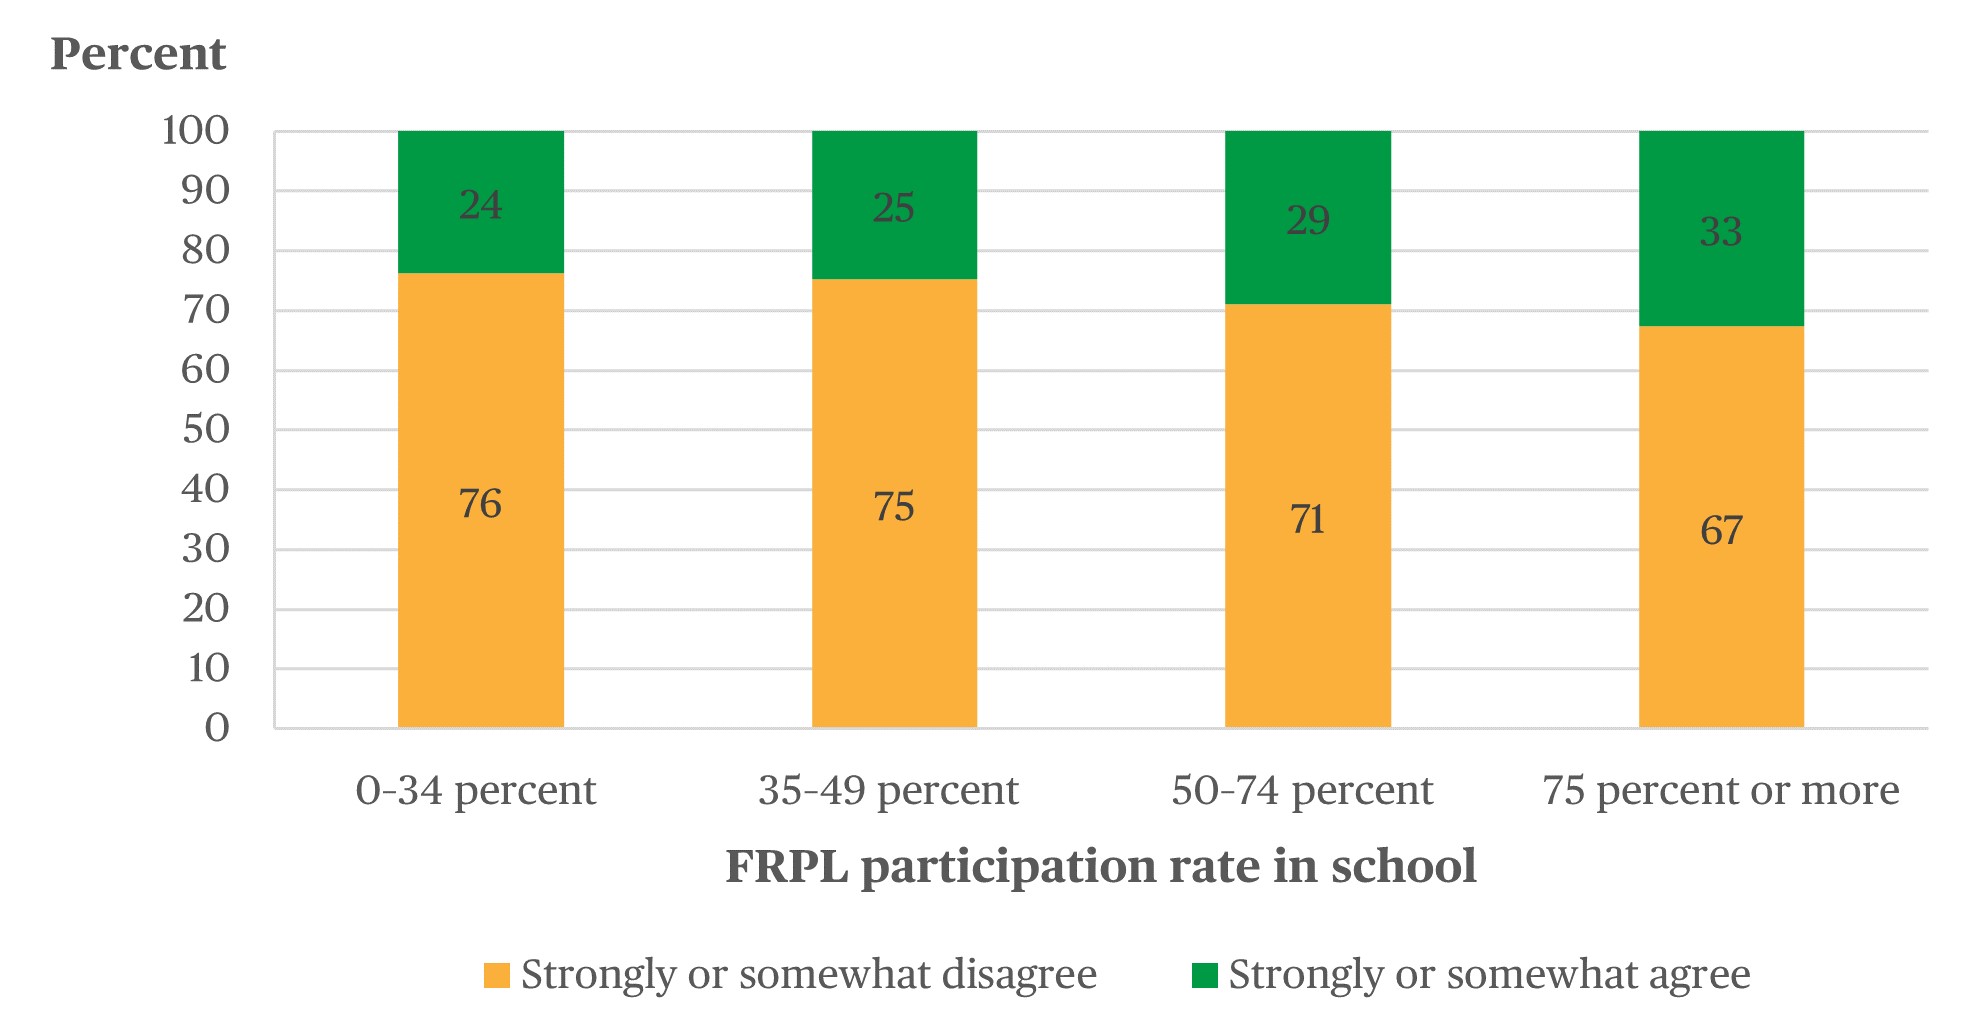
- More teachers in high-poverty schools—where 75 percent or more of students were approved for the free or reduced-price lunch (FRPL) program—agreed with the statement (33 percent) than did teachers in low-poverty schools—where 0–34 percent of students were approved for FRPL (24 percent) (figure 1).
- Of the 99 percent of all public school teachers who had received any professional development during the last school year, 76 percent agreed with the statement “I have sufficient resources available for my professional development.” There are also differences in these data by state.
- Fewer teachers in high-poverty schools agreed with the statement (75 percent) than did teachers in low-poverty schools (78 percent).
Figure 1. Percentage distribution of teachers, by level of agreement with the statement “The stress and disappointments involved in teaching at this school aren’t really worth it” and FRPL participation rate of K–12 students in their school: 2017–18
 SOURCE: U.S. Department of Education, National Center for Education Statistics, National Teacher and Principal Survey (NTPS), “Public School Teacher Data File,” 2017–18.
AEW Day 5: Principals as Educators (2017–18 NTPS)
Although day 5 of Americacn Education Week celebrates substitute teachers, NTPS does not collect data on these education professionals. NTPS can, however, be used to understand school staff who have teaching responsibilities outside of their normal assignments. For example, some public school principals also teach regular classes.
- Across all U.S. public schools, 7 percent of principals also taught one or more regularly scheduled classes at their schools. These principals served for an average of 8 years and taught for an average of 4 years during those 8 years.
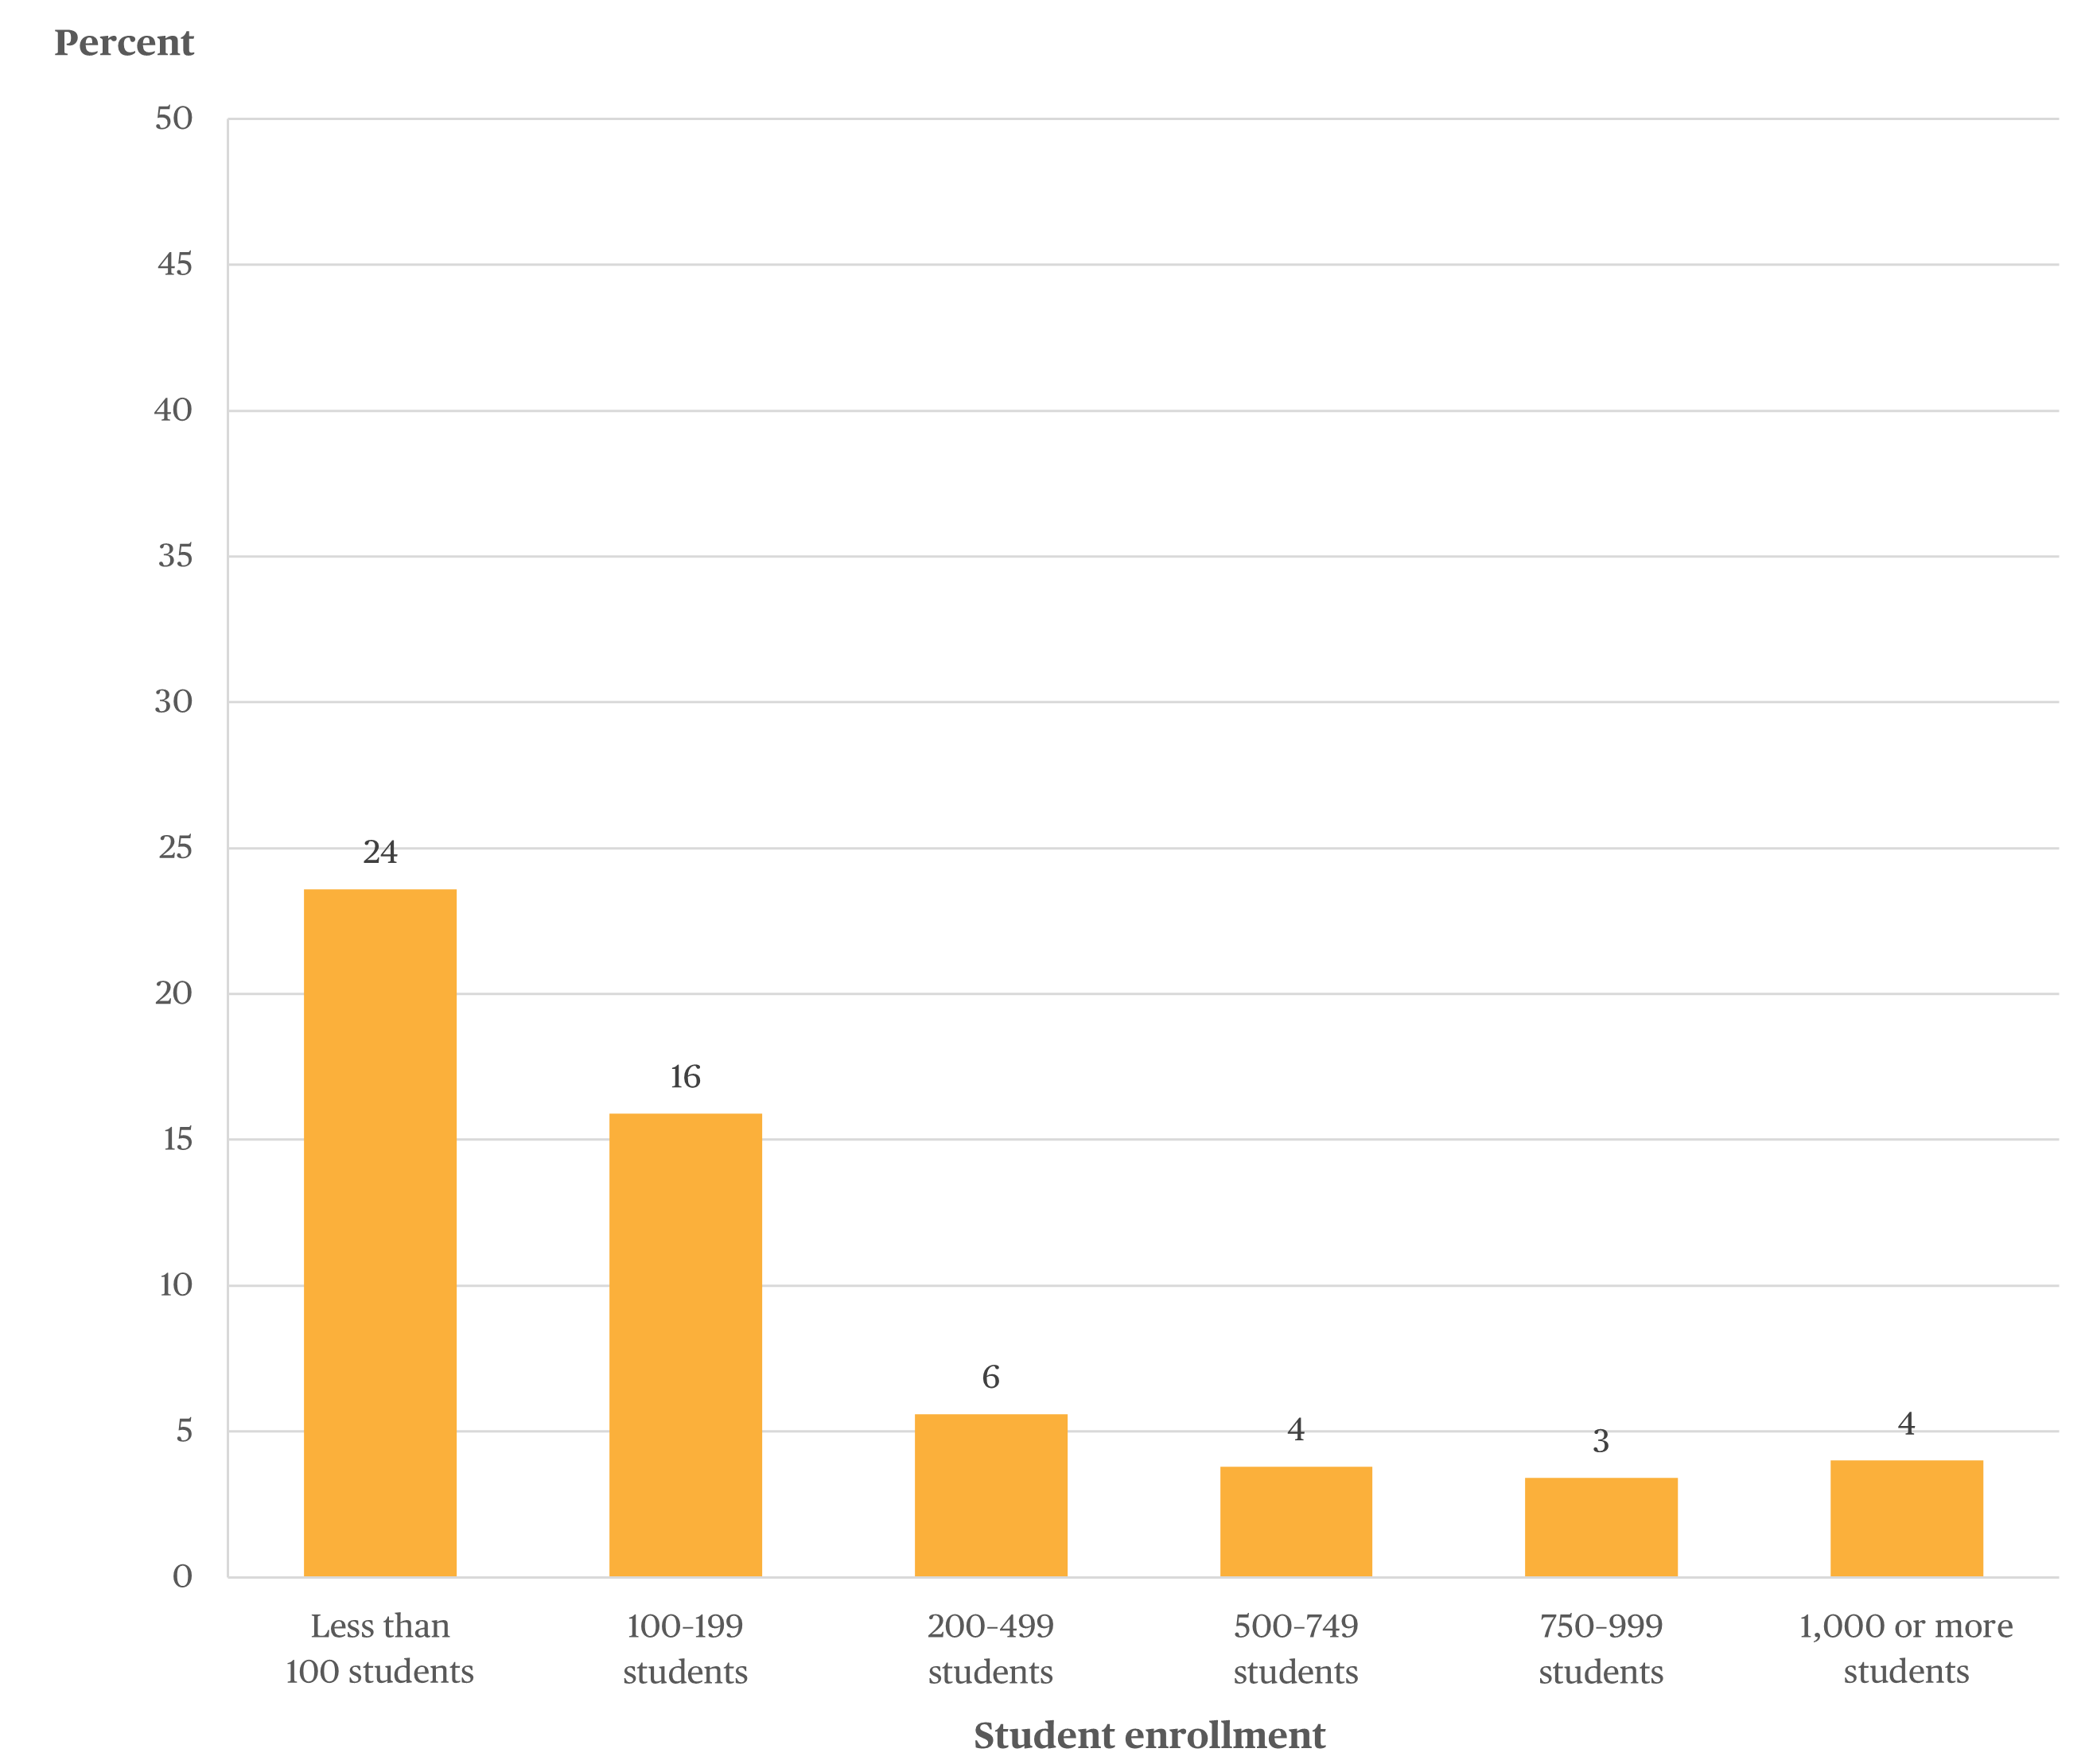
- Principals in the smallest schools (based on student enrollment) taught more often than did principals in larger schools (figure 2).
- According to the 2016–17 NTPS and the 2016–17 Principal Follow-up Survey (PFS),[1] more than 90 percent of public school principals strongly or somewhat agreed with the statement “I am generally satisfied with being principal at this school.” This percentage, however, varied by the occupational status (i.e., “stayer,” “mover,” “leaver,” or “other”[2]) the principal indicated on the PFS: 83 percent of “stayers,” 6 percent of “movers,” 9 percent of “leavers,” and 2 percent of “others” strongly or somewhat agreed with the statement (figure 3).
- However, 16 percent of public school principals strongly or somewhat agreed with the statement “the stress and disappointments involved in being a principal at this school aren’t really worth it.”
Figure 2. Percentage of principals who regularly taught one or more classes, by student enrollment in their school: 2017–18
 SOURCE: U.S. Department of Education, National Center for Education Statistics, National Teacher and Principal Survey (NTPS), “Public School Principal Data File,” 2017–18.
Figure 3. Percentage of 2015–16 public school principals who reported that they strongly or somewhat agree with statements about job satisfaction, by principals’ 2016–17 occupational status: 2016–17
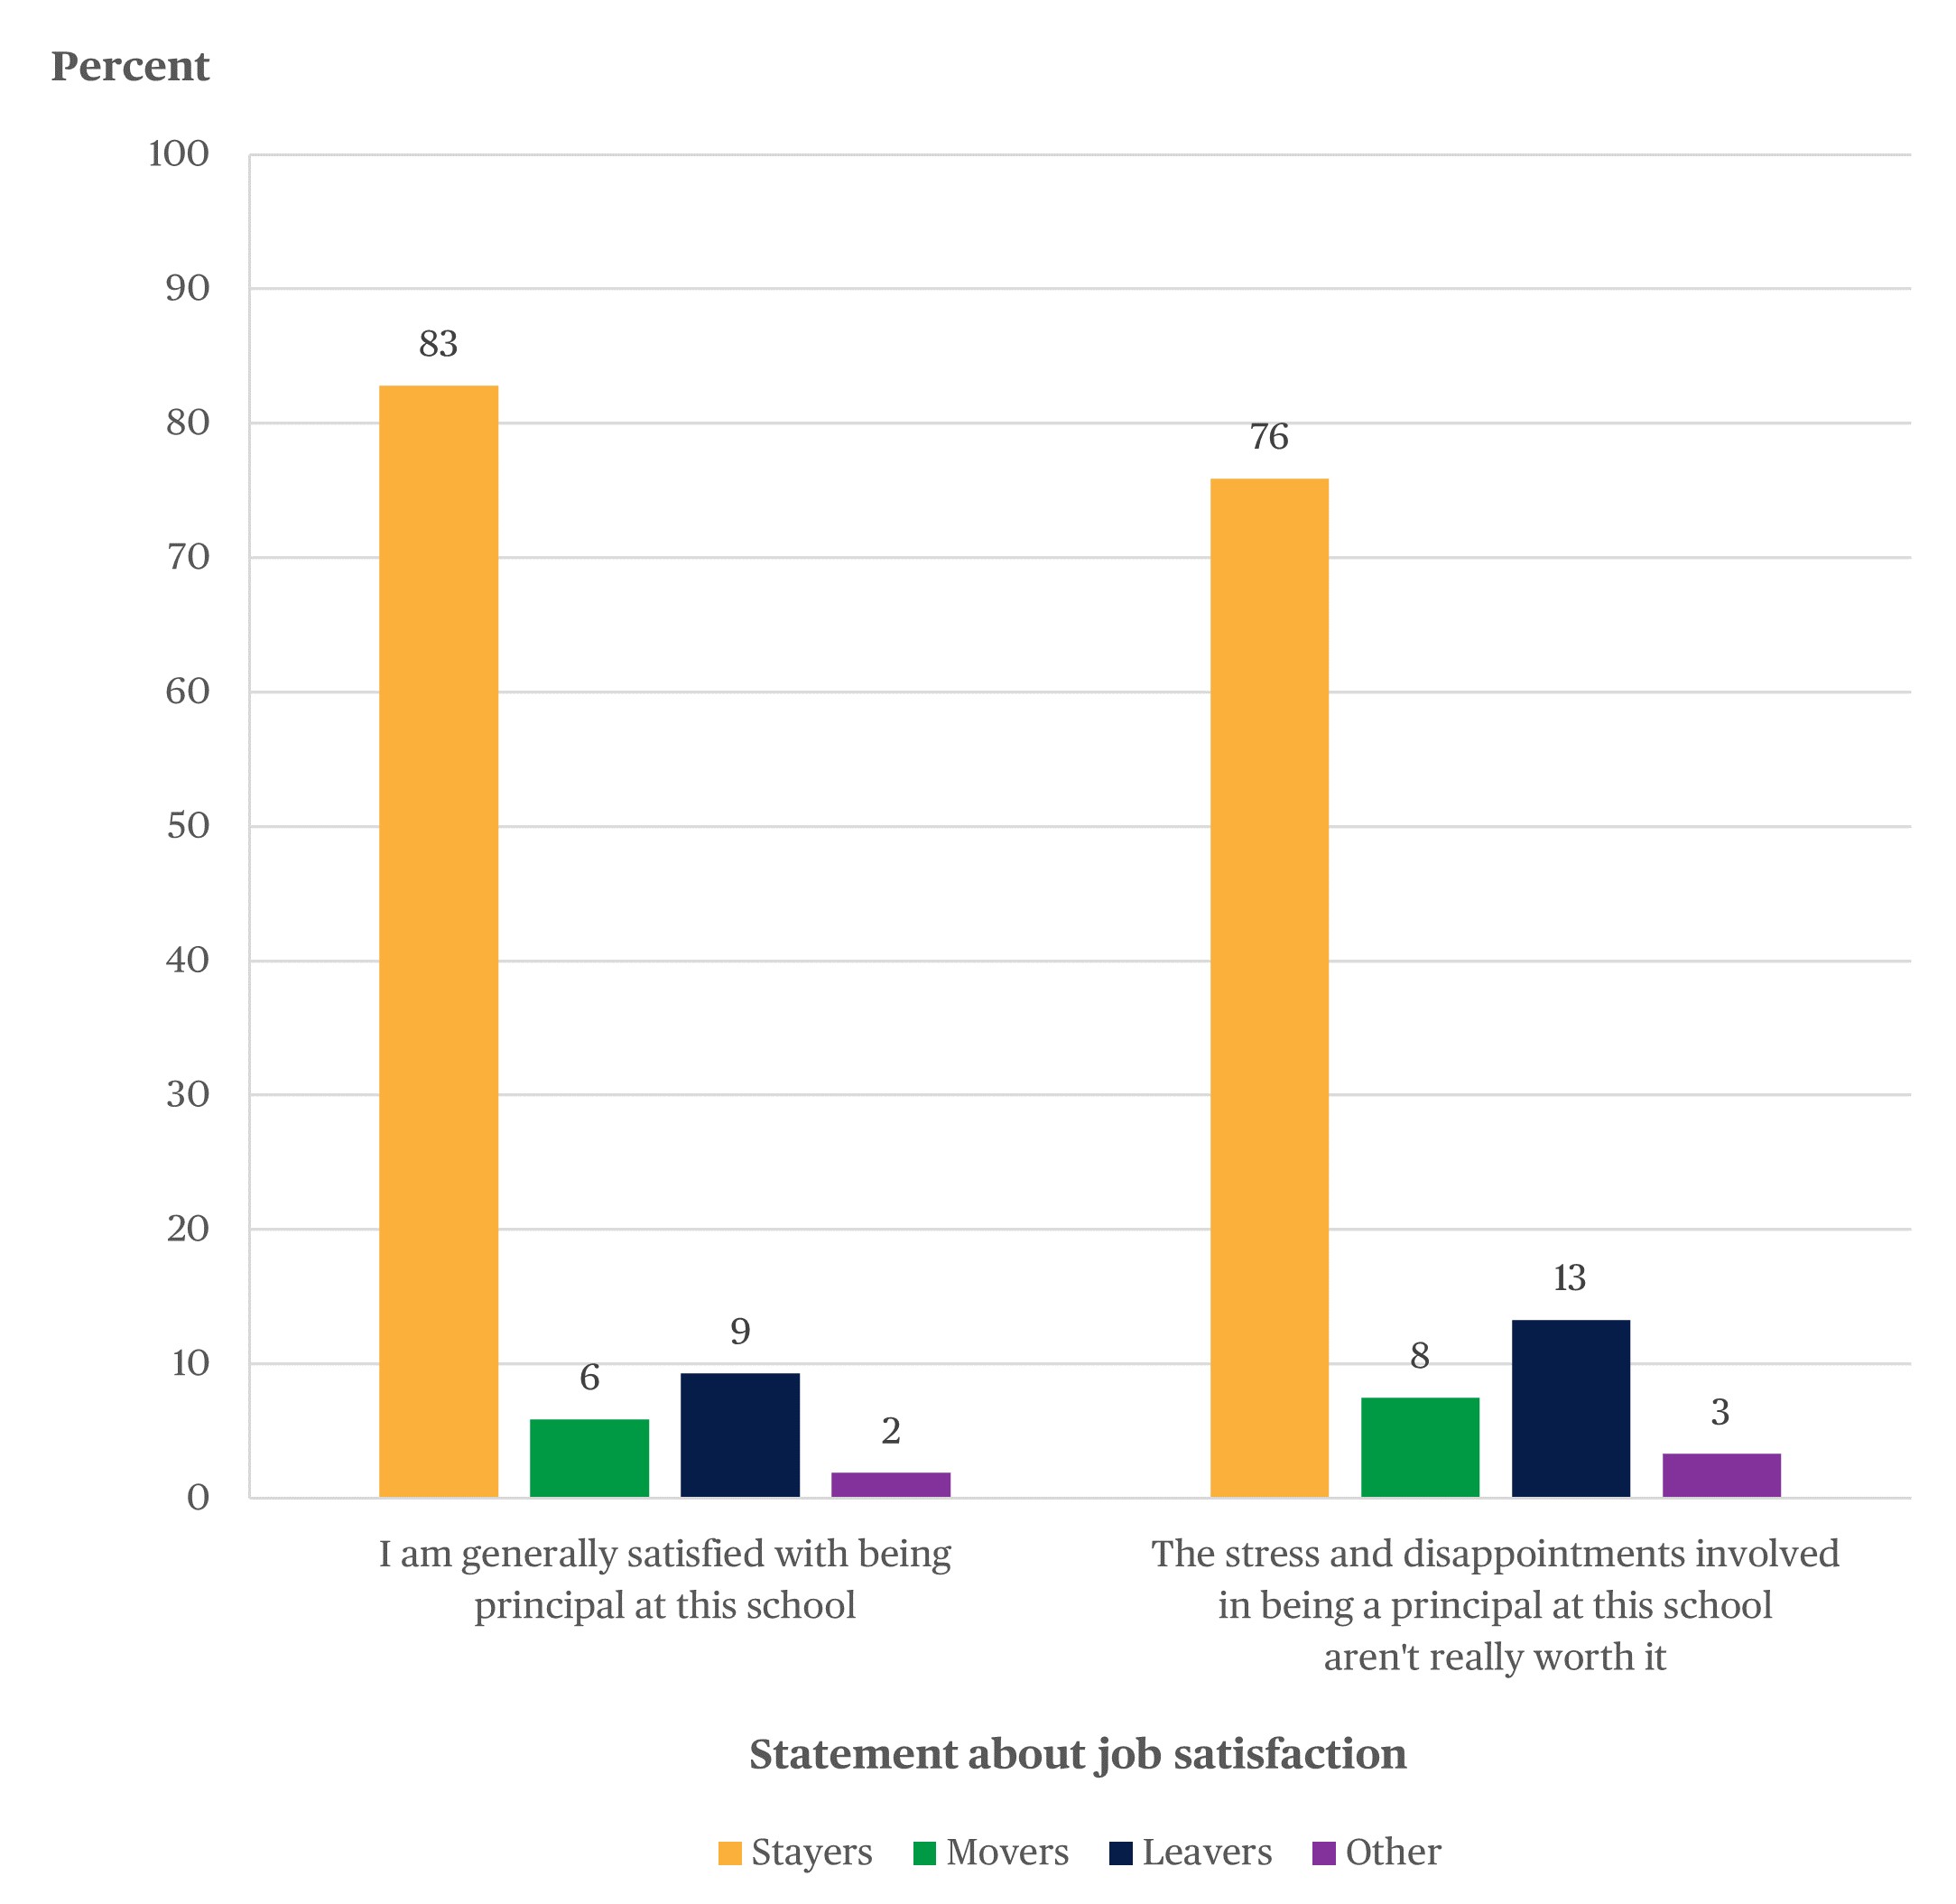 NOTE: “Stayers” are principals who were principals in the same school in the current school year as in the base year. “Movers” are principals who were still principals in the current school year but had moved to a different school after the base year. “Leavers” are principals who were no longer principals after the base year. “Other” includes principals who had left their base-year school, but for whom it was not possible to determine a mover or leaver status in the current school year. Detail may not sum to totals because of rounding.
SOURCE: U.S. Department of Education, National Center for Education Statistics, National Teacher and Principal Survey (NTPS), “Public School Principal Data File,” 2015–16; and Principal Follow-up Survey (PFS), “Public School Principal Status Data File,” 2016–17.
In honor of American Education Week, NCES would like to thank every parent and/or guardian, education support professional, educator, and principal who makes public education possible for students every day!
The data in this blog would not be possible without the participation of teachers, principals, and school staff in the NTPS. We are currently conducting the 2020–21 NTPS. The data collected this school year will be important for understanding how education has changed during the coronavirus pandemic. If you were contacted about participating in the 2020–21 NTPS and have questions, please email ntps@census.gov or call 1-888-595-1338.
For more information about the National Teacher and Principal Survey (NTPS), please visit https://nces.ed.gov/surveys/ntps/. More findings and details are available in the NTPS school, teacher, and principal reports.
By Julia Merlin, NCES
[1] The last time the data were collected prior to 2020–21 was in 2016–17.
[2] “Stayers” were public school principals who stayed in the same position at the same school in the year following the NTPS collection or during the PFS collection; “Movers” were public school principals who moved to work as a principal at a different school in the year following the NTPS collection or during the PFS collection; “Leavers” were public school principals who stopped working as a principal in the year following the NTPS collection or during the PFS collection; and “Others” were principals who were no longer at the same school but whose occupational status was unknown.