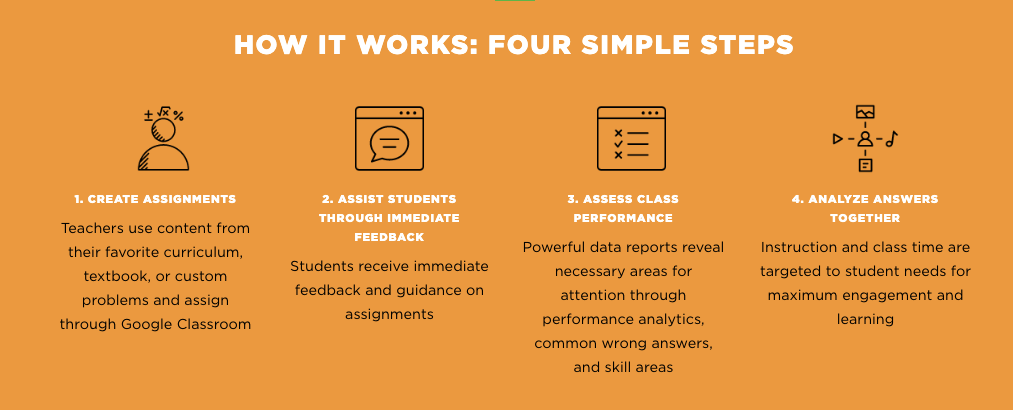
ASSISTments is a free, web-based formative assessment platform for teachers and students in Grades 3 through 12. The tool is designed for teachers to easily assign students math problems from OER textbooks such as Illustrative Math and EngageNY, existing item banks, or items they have developed on their own. ASSISTments will continually assess students as they solve math problems and provide immediate feedback and the chance to try again. The computer-generated reports provide teachers with information to make real-time adjustments to their instruction. Teachers can use it with their school’s existing learner management systems, such as Google Classroom and Canvas. Watch a video here.
Over the past 13 years, ASSISTments was developed and evaluated with the support of a series of IES and National Science Foundation awards. With a 2003 IES award to Carnegie Mellon University and Worcester Polytechnic Institute (WPI), researchers created the first version of ASSISTments. The system was populated with Massachusetts high-stakes mathematics test questions and the tutoring for the questions was authored by WPI staff with assistance from local teachers. After students completed problems assigned by the teacher, reports provided teachers with information about question difficulty and the most commonly submitted wrong answers, initiating class discussions around the completed assignments. In 2007, researchers at WPI received an award to build additional functionalities in the ASSISTments program so that teachers could assign supports (called “skill builders”) to students to help them master content. An additional eight grants allowed the researchers to create other features.
With a 2012 IES research grant award, SRI evaluated the efficacy of the ASSISTments program as a homework tool for academic learning. In the study, the researchers took all 7th grade textbooks in the State of Maine and added answers to homework problems into ASSISTments. The results of the efficacy trial demonstrated that teachers changed their homework reviewing behavior, mathematical learning improved an extra three quarters of a year of schooling, and using ASSISTments reliably closed achievement gaps for students with different achievement levels. ASSISTments is currently being evaluated again through two IES studies, with over 120 schools, to attempt to replicate this result. To view all publications related to ASSISTments, see here.
As of 2020, ASSISTments has been used by approximately 60,000 students with over 12 million problems solved.
Interview with Neil Heffernan and Cristina Heffernan
From the start of the project, was it always a goal that ASSISTments would one day be used on a wide scale?
We created ASSISTments to help as many teachers and students as possible. After we learned that the ASSISTments intervention was effective, we set the goal to have every middle school student in the country get immediate feedback on their homework. We created ASSISTments to be used by real teachers and have been improving it with each grant. Because of the effectiveness of ASSISTments, we kept getting funded to make improvements allowing our user base to grow.
At what point was ASSISTments ready to be used at a large scale in schools?
We were ready in year one because of the simplicity of our software. Now that we integrated seamlessly with Google Classroom, most teachers can use the system without training!
ASSISTments is backed by a lot of research, which would make some think that it would be easy for many schools to adopt. What were (or are) the biggest obstacles to ASSISTments being used in more schools?
A big obstacle has been access to technology for all students. The current environment in schools is making that less and less of a barrier. Now, teachers are looking for effective ways to use the computers they have.
What options did you consider to begin distributing ASSISTments?
We had major companies try to buy us out, but we turned them all down. We knew the value was being in control so we could run research studies, let others run research studies and AB test new ideas. It was important to us to keep ASSISTments free to teachers. It is also a necessity since we crowdsource from teachers.
How do you do marketing?
Our biggest obstacle is marketing. But we are lucky to have just received $1 million in funding from a philanthropy to create a nonprofit to support the work of making our product accessible. Foundation funding has allowed us to hire staff members to write marketing materials including a new website, op-eds, blog posts and press releases. In addition to our internal marketing staff member, we work extensively with The Learning Agency to get press and foundation support for ASSISTments.
What costs are associated with the launch and distribution of ASSISTments, including marketing? Will a revenue model needed sustain ASSISTments over time?
When creating ASSISTments, we didn’t want a traditional business model based on schools paying. Our vision for future growth, instead, focused on crowdsourcing ideas from teachers and testing them. We are trying to replicate the Wikimedia platform idea created by Jimmy Wales. He crowdsources the content that makes up the encyclopedia, so it must be free. We envision using ASSISTments to help us crowdsource hints and explanations for all the commonly used questions in middle school mathematics.
Do you have any agreement about the IP with the universities where ASSISTments was developed?
The ASSISTments Foundation was founded in 2019 and supports our project work in tandem with Worcester Polytechnic Institute due to our integration with research. The close relationship takes care of any issues that would arise with intellectual property. Additionally, the fact that we are a nonprofit helps address these issues.
How do you describe the experience of commercializing ASSISTments? What would you say is most needed for gaining traction in the marketplace?
Even though we are free, we do have several competitors. To gain traction, we have found that word of mouth is an effective disseminator and our positive efficacy trial result. Currently, there are many teachers on Facebook sharing how much they like ASSISTments. We also attend conferences and are working on an email campaign to get new users onboard.
Do you have advice for university researchers seeking to move their laboratory research into widespread practice?
Make sure your work is accessible and meaningful! We are solving a super-pervasive problem of homework in schools. Everyone finds meaning in making homework better.
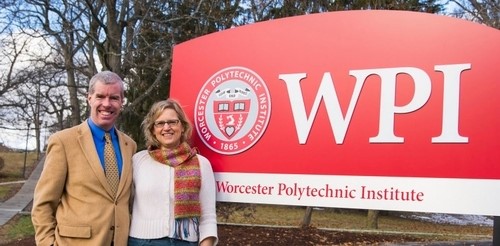
Neil Heffernan (@NeilTHeffernan) is a professor of computer science and Director of Learning Sciences and Technologies at Worcester Polytechnic Institute. He developed ASSISTments not only to help teachers be more effective in the classroom but also so that he could use the platform to conduct studies to improve the quality of education.
Cristina Heffernan (@CristinaHeff) is the Lead Strategist for the ASSISTments Project at WPI. She began her career in education as a math teacher in the Peace Corps and after went on to teach middle school math in the US. She began working with teachers while a graduate student at the University of Pittsburgh. As one of the co-founders of ASSISTments, Cristina has nurtured the system to be a tool for teachers to improve what they already do well in the classroom.
This interview was produced by Edward Metz of the Institute of Education Sciences. This is the fourth in an ongoing series of blog posts examining moving from university research to practice at scale in education.