IES Blog

Institute of Education Sciences

Connect with NCES Researchers at Upcoming Summer Conferences: STATS-DC, JSM and ASA

NCES staff will share their knowledge and expertise through research presentations, training sessions, and booth demonstrations at three notable conferences this summer (listed below). The NCES booth will be also be featured at exhibit halls where conference attendees can “ask an NCES expert,” learn how NCES data can support their research, or pick up publications and products.

NCES STATS-DC Data Conference

July 25 – 27
Washington, DC
The Mayflower Hotel

STAT-DC is NCES’ annual conference designed to provide the latest information, resources and training on accessing and using federal education data. Researchers, policymakers and data system managers from all levels are invited to discover innovations in the design and implementation of data collections and information systems. There is no registration fee to attend STATS-DCparticipants must complete registration paperwork onsite at the conference.

Key conference items:

  • Learn updates on federal and state activities affecting data collection and reporting, with a focus on the best new approaches in education statistics
  • Attend general information sessions on CCD, data management, data use, and data privacy, etc.
  • Partake in trainings for Common Core of Data (CCD) and EDFacts data coordinators
  • Attend data tools and resource demonstrations from NCES staff during designated times at the NCES exhibit booth.

NCES Staff Presentations:

Explore the full conference agenda. Some highlighted sessions are shown below.

WEDNESDAY, JULY 25

9:00 a.m. – 12:00 noon
Common Core of Data (CCD) Fiscal Coordinators' Training
District Ballroom

1:15 p.m. – 2:15 p.m.
Opening Plenary Session by Dr. Lynn Woodworth
Grand Ballroom

4:30 p.m. – 5:20 p.m.
Introduction to the Common Core of Data: America's Public Schools by Mark Glander
Palm Court Ballroom

9:00 a.m. – 12:30 p.m.
EDFacts and Common Core of Data (CCD) Nonfiscal Coordinators’ Training
Grand Ballroom

THURSDAY, JULY 26

9:00 a.m. – 10:00 a.m.
Title I Allocations by Bill Sonnenberg
Palm Court Ballroom


American Statistical Association – Joint Statistical Meetings

July 28 – August 2
Vancouver, British Columbia, Canada
Vancouver Convention Centre

JSM is the largest gathering of statisticians and data scientists in North America. Exchange ideas and explore opportunities for collaboration across industries with NCES staff and other statisticians in academia, business, and government.
 

Key conference items:

  • Review applications and methodology of statistics, such as analytics and data science
  • Attend technical sessions, poster presentations, roundtable discussions, professional development courses and workshops
  • Visit the NCES booth in the exhibit hall booth #227 and meet the NCES Chief Statistician, Marilyn Seastrom.

NCES Staff Presentation:

THURSDAY, AUGUST 2
8:35 a.m. – 10:30 a.m.
Educating the Government Workforce to Lead with Statistics by Andrew White
CC-East 10


American Sociological Association – Annual Meeting

August 11 – August 14
Philadelphia, Pennsylvania
Pennsylvania Convention Center and the Philadelphia Marriott Downtown

Professionals involved in the scientific study of society will share knowledge and discuss new directions in research and practice during this annual meeting.

Key conference items:

  • Choose from 600 program sessions throughout the 4-day conference
  • Browse and discuss topics from 3,000+ research papers submitted
  • Swing by the NCES exhibit hall booth #211


Follow us on twitter (@EdNCES) throughout these upcoming conferences to stay up to date and learn the latest in education statistics. We hope you’ll join us whether in person or online!

What Are Threat Assessment Teams and How Prevalent Are They in Public Schools?

As part of the Safe School Initiative, the U.S. Department of Education and U.S. Secret Service authored a report in 2004 that described how schools could establish a threat assessment process “for identifying, assessing, and managing students who may pose a threat of targeted violence in schools.” School-based threat assessment teams are intended to prevent and reduce school violence and are adapted from the U.S. Secret Service’s threat assessment model.

The School Survey on Crime and Safety (SSOCS) collected data on the prevalence of threat assessment teams in schools for the first time in 2015–16 from a nationally representative sample of 3,500 K–12 public schools. The questionnaire defined a threat assessment team as “a formalized group of persons who meet on a regular basis with the common purpose of identifying, assessing, and managing students who may pose a threat of targeted violence in schools.” School-based threat assessment teams are usually composed of some combination of school administrators, teachers, counselors, sworn law enforcement officers, and mental health professionals.

While 42 percent of all public schools reported having a threat assessment team during the 2015–16 school year, the prevalence of threat assessment teams varied by school characteristics.


Percentage of public schools that reported having a threat assessment team, by school level and enrollment size: School year 2015–16

1Primary schools are defined as schools in which the lowest grade is not higher than grade 3 and the highest grade is not higher than grade 8. Middle schools are defined as schools in which the lowest grade is not lower than grade 4 and the highest grade is not higher than grade 9. High schools are defined as schools in which the lowest grade is not lower than grade 9 and the highest grade is not higher than grade 12. Combined schools include all other combinations of grades, including K–12 schools.
NOTE: A threat assessment team was defined for respondents as a formalized group of persons who meet on a regular basis with the common purpose of identifying, assessing, and managing students who may pose a threat of targeted violence in schools. Responses were provided by the principal or the person most knowledgeable about school crime and policies to provide a safe environment. Although rounded numbers are displayed, the figures are based on unrounded estimates.
SOURCE: U.S. Department of Education, National Center for Education Statistics, 2015–16 School Survey on Crime and Safety (SSOCS), 2016. See table 35.


For example, a higher percentage of high schools (52 percent) than of middle (45 percent), primary (39 percent), and combined schools (28 percent) reported having a threat assessment team during the 2015–16 school year. Further, 57 percent of schools with an enrollment size of 1,000 or more students reported having a threat assessment team, compared with 31 percent of schools with an enrollment size of less than 300 students; 40 percent of schools with an enrollment size of 300–499 students; and 45 percent of schools with an enrollment size of 500–999 students.

Threat assessment teams were also more prevalent in schools that had at least one security staff[i] member present at school at least once a week during the 2015–16 school year (48 percent of schools with security staff present vs. 33 percent of schools without security staff present). The percentage of schools reporting a threat assessment team was also higher in schools that reported at least one violent incident[ii] had occurred at school during the 2015–16 school year (44 percent) compared with schools that had no violent incidents (35 percent).

How often a threat assessment team meets can be an indication of how active the team is in the school.  The majority of schools with a threat assessment team in 2015–16 reported that their teams met “on occasion” (62 percent), followed by “at least once a month” (27 percent), “at least once a week” (9 percent), and “never” (2 percent).


Among public schools that reported having a threat assessment team, percentage distribution by frequency of threat assessment team meetings: School year 2015–16

!Interpret data with caution. The coefficient of variation (CV) for this estimate is between 30 and 50 percent.
NOTE: A threat assessment team was defined for respondents as a formalized group of persons who meet on a regular basis with the common purpose of identifying, assessing, and managing students who may pose a threat of targeted violence in schools. Responses were provided by the principal or the person most knowledgeable about school crime and policies to provide a safe environment.
SOURCE: U.S. Department of Education, National Center for Education Statistics, 2015–16 School Survey on Crime and Safety (SSOCS), 2016. See table 35.


You can find more information on school crime and safety in NCES publications, including Crime, Violence, Discipline, and Safety in U.S. Public Schools: Findings From the School Survey on Crime and Safety: 2015–16 and the 2017 Indicators of School Crime and Safety.


By Rachel Hansen, NCES and Melissa Diliberti, AIR


[i] Security staff includes full- or part-time school resource officers, sworn law enforcement officers, or security guards or security personnel present at school at least once a week.

[ii] Violent incidents include rape or attempted rape, sexual assault other than rape (including threatened rape), physical attack or fight with or without a weapon, threat of physical attack with or without a weapon, and robbery (taking things by force) with or without a weapon.


Building Evidence: Changes to the IES Goal Structure for FY 2019

The IES Goal Structure was created to support a continuum of education research that divides the research process into stages for both theoretical and practical purposes. Individually, the five goals – Exploration (Goal 1), Development and Innovation (Goal 2), Efficacy and Replication (Goal 3), Effectiveness (Goal 4), and Measurement (Goal 5) – were intended to help focus the work of researchers, while collectively they were intended to cover the range of activities needed to build evidence-based solutions to the most pressing education problems in our nation. Implicit in the goal structure is the idea that over time, researchers will identify possible strategies to improve student outcomes (Goal 1), develop and pilot-test interventions (Goal 2), and evaluate the effects of interventions with increasing rigor (Goals 3 and 4).

Over the years, IES has received many applications and funded a large number of projects under Goals 1-3.  In contrast, IES has received relatively few applications and awarded only a small number of grants under Goal 4. To find out why – and to see if there were steps IES could take to move more intervention studies through the evaluation pipeline – IES hosted a Technical Working Group (TWG) meeting in 2016 to hear views from experts on what should come after an efficacy study (see the relevant summary and blog post). IES also issued a request for public comment on this question in July 2017 (see summary).

The feedback we received was wide-ranging, but there was general agreement that IES could do more to encourage high-quality replications of interventions that show prior evidence of efficacy. One recommendation was to place more emphasis on understanding “what works for whom” under various conditions.  Another comment was that IES could provide support for a continuum of replication studies.  In particular, some commenters felt that the requirements in Goal 4 to use an independent evaluator and to carry out an evaluation under routine conditions may not be practical or feasible in all cases, and may discourage some researchers from going beyond Goal 3.   

In response to this feedback, IES revised its FY 2019 RFAs for Education Research Grants (84.305A) and Special Education Research Grants (84.324A) to make clear its interest in building more and better evidence on the efficacy and effectiveness of interventions. Among the major changes are the following:

  • Starting in FY 2019, Goal 3 will continue to support initial efficacy evaluations of interventions that have not been rigorously tested before, in addition to follow-up and retrospective studies.
  • Goal 4 will now support all replication studies of interventions that show prior evidence of efficacy, including but not limited to effectiveness studies.
  • The maximum amount of funding that may be requested under Goal 4 is higher to support more in-depth work on implementation and analysis of factors that moderate or mediate program effects.

The table below summarizes the major changes. We strongly encourage potential applicants to carefully read the RFAs (Education Research, 84.305A and Special Education Research, 84.324A) for more details and guidance, and to contact the relevant program officers with questions (contact information is in the RFA).

Applications are due August 23, 2018 by 4:30:00 pm Washington DC time.


Name Change

Focus Change

Requirements Change

Award Amount Change

Goal 3

Formerly “Efficacy and Replication;” in FY2019, “Efficacy and Follow-Up.”

Will continue to support initial efficacy evaluations of interventions in addition to follow-up and retrospective studies.

No new requirements.

No change.

Goal 4

Formerly “Effectiveness;” in FY2019, “Replication: Efficacy and Effectiveness.”

Will now support all replications evaluating the impact of an intervention. Will also support Efficacy Replication studies and Re-analysis studies.

Now contains a requirement to describe plans to conduct analyses related to implementation and analysis of key moderators and/or mediators. (These were previously recommended.)

Efficacy Replication studies maximum amount: $3,600,000.

Effectiveness studies maximum amount: $4,000,000.

Re-analysis studies maximum amount: $700,000.


By Thomas Brock (NCER Commissioner) and Joan McLaughlin (NCSER Commissioner)

A Closer Look at Teacher Income

Full-time teachers in public school earned an average of $59,050 from all income sources in the 2015–16 school year. This income includes teachers’ base teaching salary, as well as additional sources of income from their schools or districts, jobs outside the school system, and summer activities. To capture the different ways that teachers can earn income, the 2015-16 National Teacher and Principal Survey asked teachers questions about how much they earned from various sources:

  • Base teaching salary. Teachers’ average base teaching salary was $55,120 for the 2015-16 school year.
  • School supplement. About 44 percent of teachers received additional compensation for extracurricular or additional activities in their school system, such as coaching, sponsoring student activities, mentoring teachers, or teaching evening classes. These teachers earned an average of $2,630 for these activities.
  • Merit pay. Some teachers earned merit pay or pay-for-performance income based on their students’ performance. About 6 percent of teachers received this type of additional compensation, with an average amount awarded of $1,470.
  • Other school system support. About 8 percent of teachers received income during the school year from some other source in their school system, such as a state supplement, for an average of $2,670.
  • Outside jobs. During the 2015-16 school year, 18 percent of teachers held a job outside the school system, earning an average of $5,140. Teachers categorized these jobs as teaching or tutoring (5 percent), non-teaching but related to the teaching field (4 percent), or in another field (9 percent).
  • Summer jobs. In the summer of 2015, before the start of the 2015-16 school year, 20 percent of teachers earned income from either a school-based teaching position, such as teaching summer school, or a non-teaching position, and 16 percent earned income from a non-school job. Teachers earned an average of $2,700 from school-based summer positions, and an average of $4,060 in a non-school job.

To learn about teachers’ satisfaction with their teaching salary, more information is available in the short report Teacher Satisfaction with Salary and Current Job.

The National Teacher and Principal Survey (NTPS) includes data on a wide variety of other topics as well. Visit the website to learn more.

By Maura Spiegelman

Explore Data on Mental Health Services in K–12 Public Schools for Mental Health Awareness Month

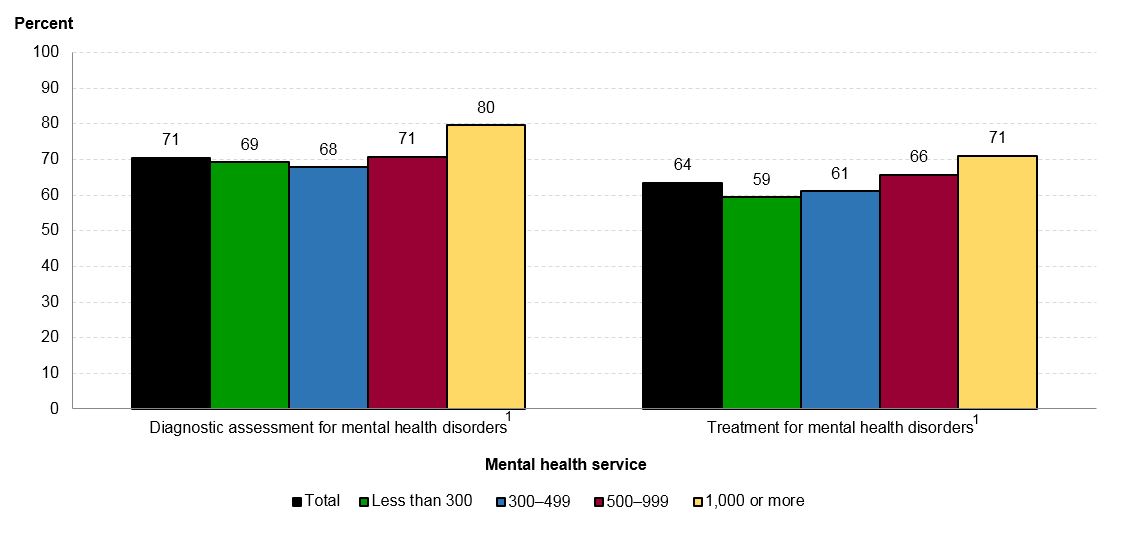
It’s important for schools to help ensure students are safe and healthy, both physically and mentally, so that learning can occur. In addition to implementing security measures on school campuses, there has been a growing focus on whether schools provide mental health services. In school year 2015–16, some 71 percent of public schools reported having diagnostic assessments for mental health disorders available to students, and 64 percent of schools reported having treatment available. [i]

These data come from the School Survey on Crime and Safety (SSOCS). The 2015–16 SSOCS questionnaire added new questions asking principals to report whether diagnostic assessment and treatment services for mental health were available to students under the official responsibilities of a licensed mental health professional.[ii] Diagnostic assessments are used to identify whether a student has one or more medical and/or mental health diagnoses. Treatment is a clinical service, such as psychotherapy, medication, or counseling, which is intended to lessen or eliminate the symptoms of a disorder.

The prevalence of mental health services varied by school characteristics. In both middle and high schools, diagnostic assessment services were more common than treatment services: 74 percent of middle schools and 79 percent of high schools reported diagnostic assessments were available, compared with 66 percent of middle schools and 69 percent of high schools reporting treatment services were available. Compared to primary schools, a higher percentage of high schools reported that both types of mental health services were available.


Figure 1. Percentage of public schools reporting the availability of mental health services under the official responsibilities of a licensed mental health professional, by type of mental health service and school enrollment size: School year 2015–16

1Mental health disorders were defined for respondents as, collectively, all diagnosable mental disorders or health conditions that are characterized by alterations in thinking, mood, or behavior (or some combination thereof) associated with distress and/or impaired functioning.
NOTE: Mental health services are provided by several different types of mental health professionals, each of which have their own training and areas of expertise. The types of professionals who may provide mental health services include psychiatrists, psychologists, psychiatric/mental health nurse practitioners, psychiatric/mental health nurses, clinical social workers, and professional counselors. Responses were provided by the principal or the person most knowledgeable about school crime and policies to provide a safe environment.
SOURCE: U.S. Department of Education, National Center for Education Statistics, 2015–16 School Survey on Crime and Safety (SSOCS), 2016. See table 40.


The percentage of schools with 1,000 or more students that reported having diagnostic assessment services available (80 percent) was higher than the percentages of schools with fewer than 300 students (69 percent), 300–499 students (68 percent), and 500–999 students (71 percent).

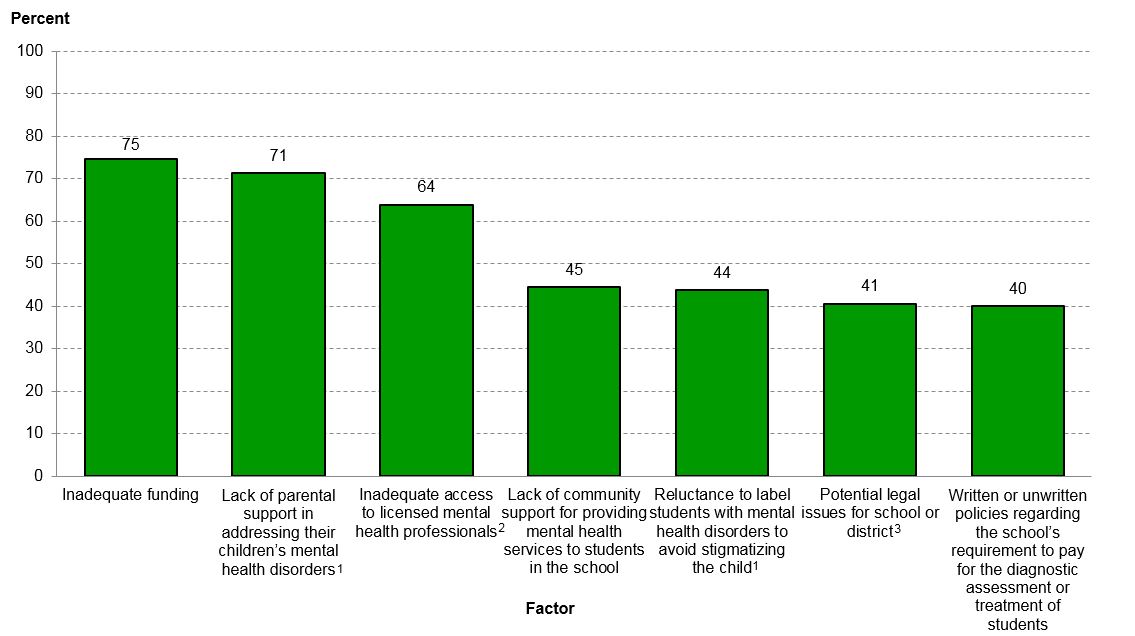
The questionnaire also asked principals to report to what extent certain factors limited the school’s efforts to provide mental health services to students. The most common limiting factors reported by schools were inadequate funding (75 percent) and lack of parental support (71 percent).


Figure 2. Percentage of public schools reporting that their efforts to provide mental health services to students were limited in a major or minor way due to specified non-school-level factors: School year 2015–16

1Mental health disorders were defined for respondents as, collectively, all diagnosable mental disorders or health conditions that are characterized by alterations in thinking, mood, or behavior (or some combination thereof) associated with distress and/or impaired functioning.
2Mental health services are provided by several different types of mental health professionals, each of which have their own training and areas of expertise. The types of professionals who may provide mental health services include psychiatrists, psychologists, psychiatric/mental health nurse practitioners, psychiatric/mental health nurses, clinical social workers, and professional counselors. 
3Examples of legal issues provided to respondents were malpractice and insufficient supervision.
NOTE: Respondents were asked to rate the level of limitation in their school’s efforts to provide mental health services to students for each factor. Survey response options included “limits in major way,” “limits in minor way,” or “does not limit." Responses were provided by the principal or the person most knowledgeable about school crime and policies to provide a safe environment.
SOURCE: U.S. Department of Education, National Center for Education Statistics, 2015–16 School Survey on Crime and Safety (SSOCS), 2016. See table 39.


You can find more information on school crime and safety in NCES publications, including Crime, Violence, Discipline, and Safety in U.S. Public Schools: Findings From the School Survey on Crime and Safety: 2015–16 and the 2017 Indicators of School Crime and Safety.


By Rachel Hansen, NCES and Melissa Diliberti, AIR


[i] Includes services available at school by a mental health professional employed by the school or district; services available at school by a mental health professional other than a school or district employee, funded by the school or district; and services available outside of school by a mental health professional other than a school or district employee, funded by the school or district.

[ii] The 2015–16 questionnaire provided formal definitions for many terms, including at school, diagnostic assessment, mental health disorders, mental health professionals, and treatment.